
The Kalgoorlie Super Pit, 1986 to 2025
In 1986 the Golden Mile was a scatter of old shafts, small pits and pale tailings beside Kalgoorlie and Boulder. In 1989 the leases were combined and one company began cutting a single pit through them. Slide through forty years of satellite pictures and watch the Super Pit eat the old workings, the waste dumps climb, and the tenements gather round it.
Forty years, frame by frame
One clear picture every five years, all on one grid, 15 km across. Pick a frame to open the viewer on it, drag the timeline, or press Play. Compare puts any two years side by side under a divider you drag.
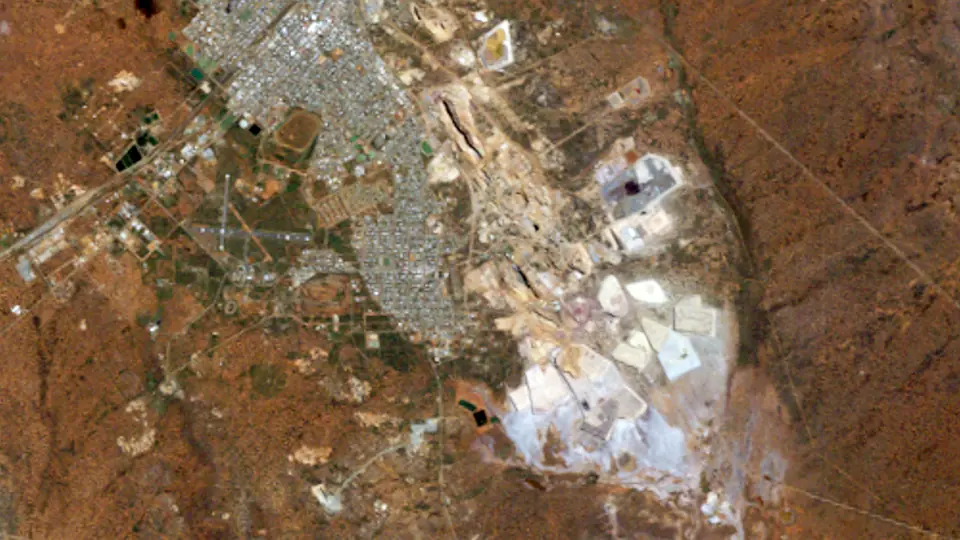 1985 · 21 Sep 1986
Landsat 5 · 12.8 km² worked
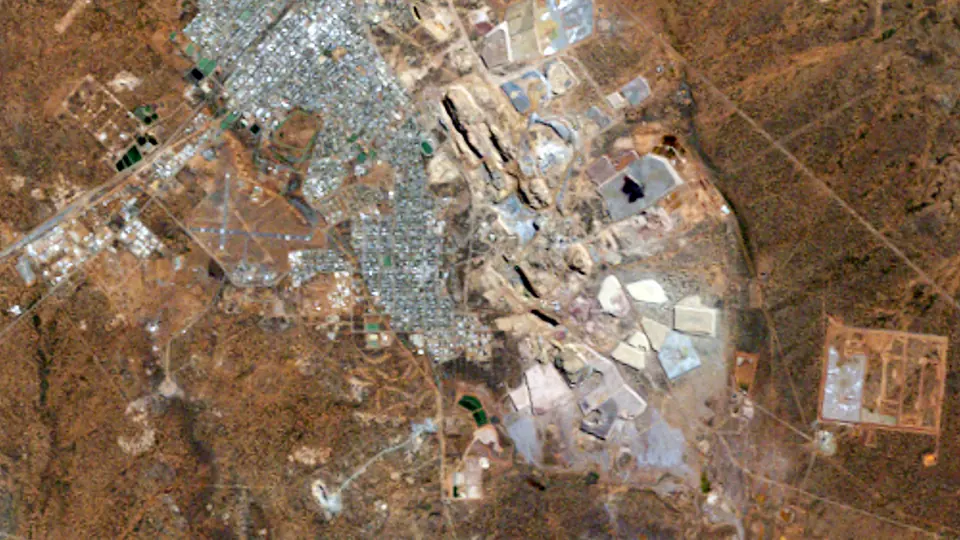 1990 · 25 Apr 1990
Landsat 5 · 20.0 km² worked
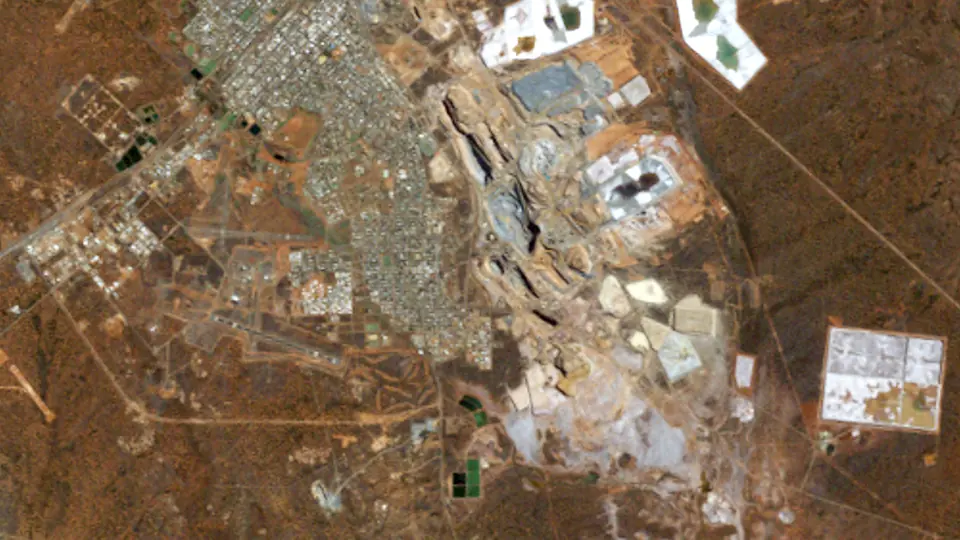 1995 · 4 Apr 1994
Landsat 5 · 24.1 km² worked
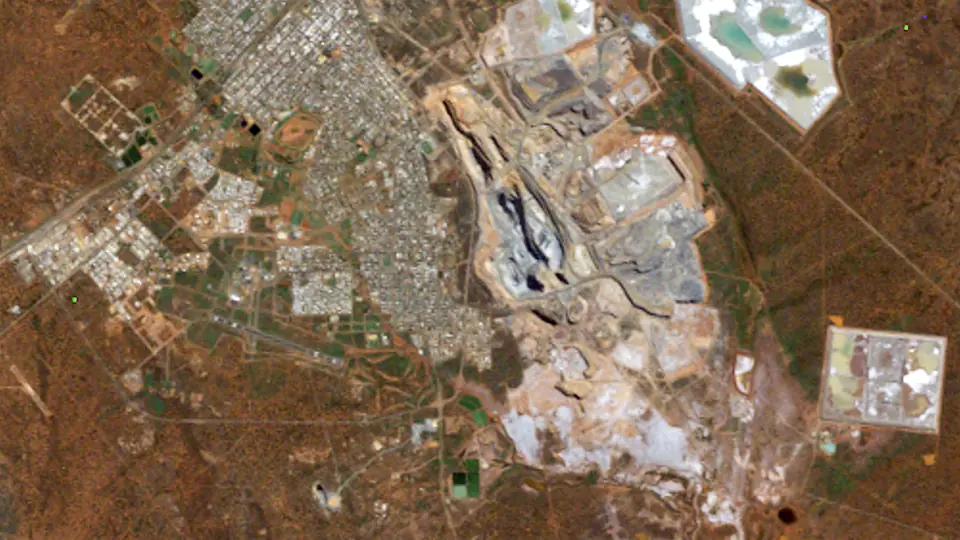 2000 · 18 Apr 1999
Landsat 5 · 29.7 km² worked
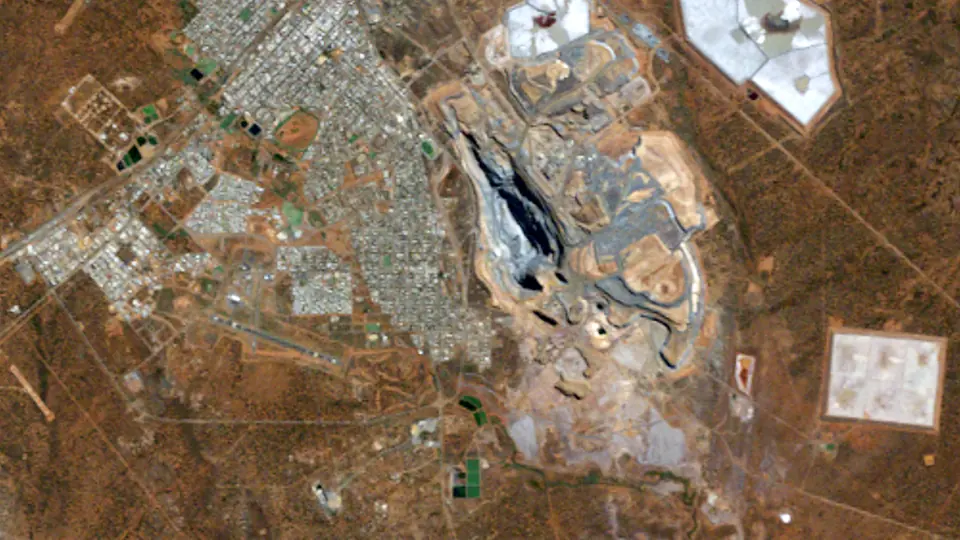 2005 · 15 Apr 2004
Landsat 5 · 30.1 km² worked
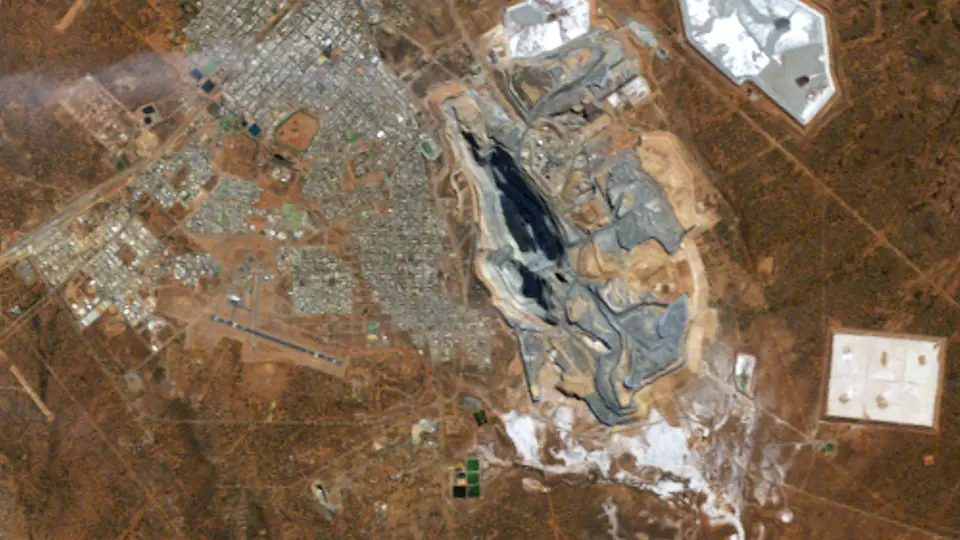 2010 · 15 May 2009
Landsat 5 · 30.4 km² worked
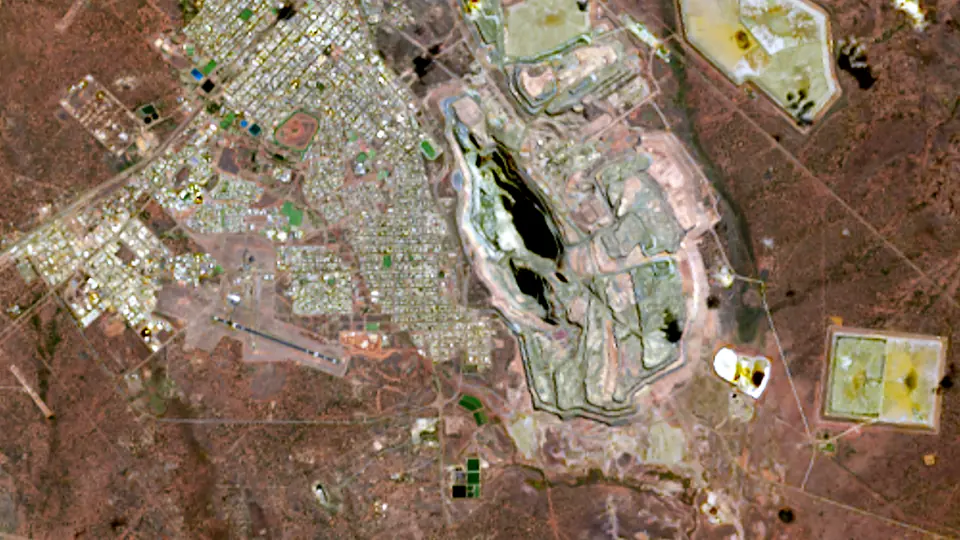 2015 · 11 Apr 2014
Landsat 8 · 31.6 km² worked
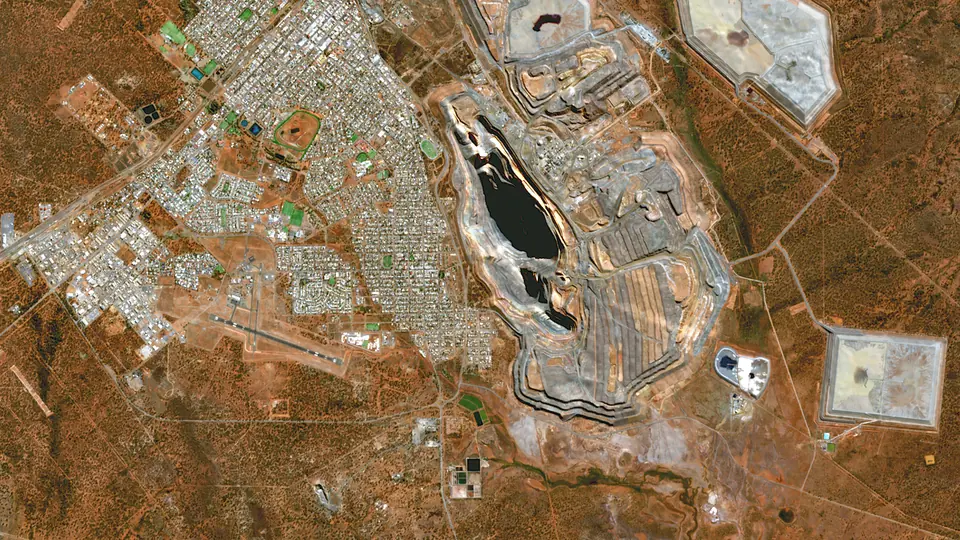 2020 · 25 May 2021
Sentinel-2B · 32.6 km² worked
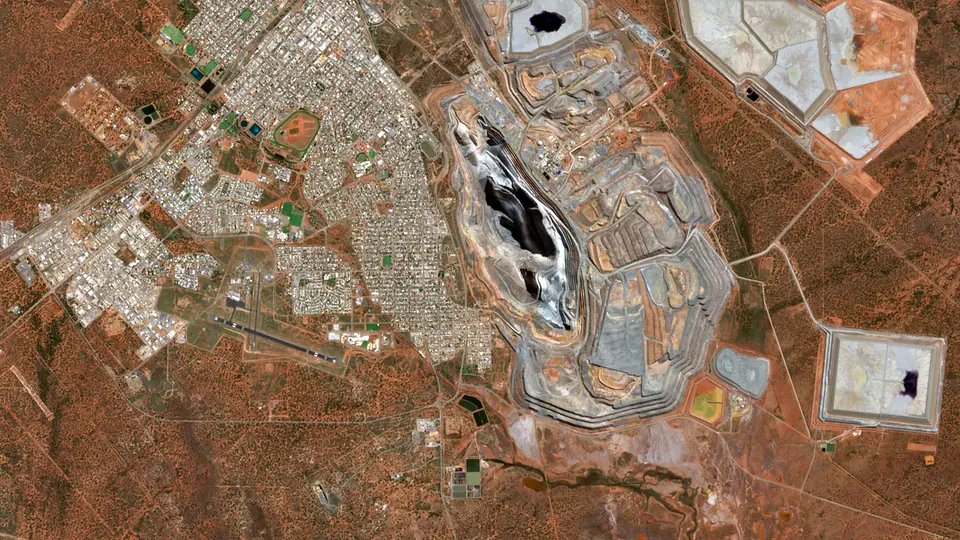 2025 · 21 Apr 2025
Sentinel-2A · 36.7 km² worked
What happened here
- 1893 Hannan's find. Paddy Hannan, Thomas Flanagan and Dan Shea found about 100 oz of alluvial gold near Mount Charlotte in June 1893, and Kalgoorlie grew from the rush. [1][2]
- 1903 Water arrives. The Goldfields Water Supply Scheme pumped water 566 km from Mundaring Weir to Kalgoorlie, lifting it 390 m. It opened in January 1903. [3][4]
- 1989 One pit for the Golden Mile. The Golden Mile leases were combined in 1989 and KCGM was formed to run them as one open pit, the Super Pit. [2]
- 2014 The 16 millionth ounce. KCGM poured its 16 millionth ounce of gold from the Fimiston open pit in March 2014. The pit was then about 3.5 km long, 1.5 km wide and more than 600 m deep. [2]
- 2021 Fourth in Australia. The USGS lists the Super Pit fourth among Australian gold mines in 2021, with 15,200 kg, behind Boddington, Cadia East and Fosterville. [5]
More on the mine's history is on Kalgoorlie Super Pit in the history of mining, and on the gold page and mining in Australia.
Gold output by year
Gold output from Kalgoorlie Super Pit in the years with an open, mine-level figure: the Jasansky et al. open database of mine production (CC BY 4.0) and the operators' own filings. Years with no open mine-level figure are left out rather than estimated. The timeline under the pictures shows the same bars.
The figures
| Year | Output | Basis | Source |
|---|---|---|---|
| 2000 | 788 koz | gold, contained | [6] |
| 2001 | 770 koz | gold, contained | [6] |
| 2002 | 720 koz | gold, contained | [6] |
| 2003 | 872 koz | gold, contained | [6] |
| 2004 | 888 koz | gold, contained | [6] |
| 2005 | 834 koz | gold, contained | [6] |
| 2006 | 604 koz | gold, contained | [6] |
| 2007 | 571 koz | gold, contained | [6] |
| 2008 | 557 koz | gold, contained | [6] |
| 2009 | 613 koz | gold, contained | [6] |
| 2010 | 686 koz | gold, contained | [6] |
| 2011 | 682 koz | gold, contained | [6] |
| 2012 | 620 koz | gold, contained | [6] |
| 2013 | 604 koz | gold, contained | [6] |
| 2014 | 599 koz | gold, contained | [6] |
| 2015 | 576 koz | gold, contained | [6] |
| 2016 | 696 koz | gold, contained | [6] |
| 2017 | 669 koz | gold, contained | [6] |
| 2018 | 580 koz | gold, contained | [6] |
| 2019 | 416 koz | gold, contained | [6] |
Photos
Pictures from the ground and from orbit, openly licensed. The viewer slips each one in near its year.
How this was made
Pictures. Landsat 4 and 5 (to 2011), Landsat 7 (before its 2003 scan-line fault), Landsat 8 and Sentinel-2 (2017 on), surface reflectance read from Microsoft's Planetary Computer. For each frame we take the clearest picture within a year or so of the target year, in the same season where we can, checked against each scene's own cloud mask, and cut it to one grid. One colour stretch serves every frame, and each older frame is colour-matched to the newest over the whole picture, so a change in colour is mostly a change on the ground. Landsat pixels are 30 m and Sentinel-2 pixels 10 m, so the newest frames are sharper. The date of each picture shows under the year.
Worked ground is our own estimate from the pictures. Within a box drawn round the mine, leaving the towns out, a 30 m cell counts as worked once it has lost its vegetation or changed strongly in brightness and short-wave infrared against the first frame, and the next frame sees the same change. Ground stays worked once it is worked, small specks are dropped, and holes inside the footprint are filled. It traces pits, waste dumps, tailings and plant, but it can miss ground that looks like its surroundings and catch a road or a cleared paddock. Treat the areas as a guide, not a survey. The worked ground starts in 1986 with the old Golden Mile workings and tailings already there, so the first frame is not bare ground.
Tenements are today's live and pending mining tenements from the Western Australian Government's open tenement layer (Mining Tenements DMIRS-003, via SLIP and data.wa.gov.au, CC BY 4.0), each drawn from the year it was granted. Tenements that have lapsed are not in the layer, so earlier years show fewer than were held then. Holder names are left out.
Output and milestones. Each figure and fact is linked to its source below. We report what operators and governments published and do not estimate missing years.
Sources and credits
- State Library of Western Australia: Patrick Hannan (Mining and Energy Western Australia exhibition)
- Australian Mining Review: Kalgoorlie's greatest asset (16 July 2015)
- Western Australian Museum: Building a Pipeline (WA Goldfields)
- Government of Western Australia: CY O'Connor's Golden Pipeline celebrates 120 years of service (media statement, 24 Jan 2023)
- US Geological Survey: Minerals Yearbook 2020-21, volume III: The Mineral Industry of Australia
- Jasansky, Brauneis, Maus et al. (Vienna University of Economics and Business): Open database on global coal and metal mine production (Zenodo v1.0.3; paper: Scientific Data 2023)
Satellite pictures: USGS/NASA Landsat (public domain) and contains modified Copernicus Sentinel-2 data 2025, via Microsoft Planetary Computer, processed by Prospector Trails. Photos: The Golden Mile: William Edward Fretwell (1874–1958), Wikimedia Commons, Public domain; Golden Mile, 1934: Walkabout magazine, Wikimedia Commons, Public domain; The pit, 1999: Rr2000, Wikimedia Commons, CC BY-SA 3.0; Lookout, 2010: Corrie Barklimore from Parkes, Australia, Wikimedia Commons, CC BY 2.0; The pit, 2016: Bahnfrend, Wikimedia Commons, CC BY-SA 4.0. Tenements: contains data from the Department of Energy, Mines, Industry Regulation and Safety (Government of Western Australia) via SLIP / data.wa.gov.au, licensed CC BY 4.0. Not investment advice.


More time machines
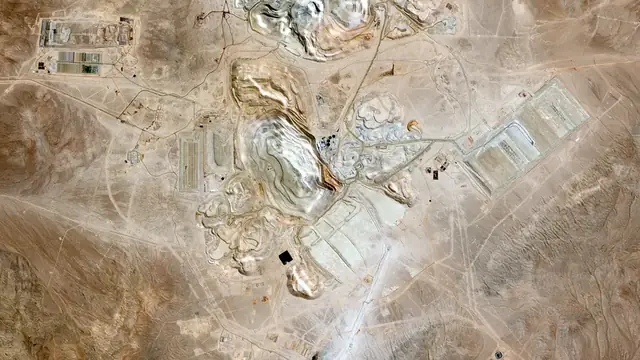
 20251986EscondidaFrom an empty Atacama valley to the world's biggest copper mine.1986 to 2025 · Chile
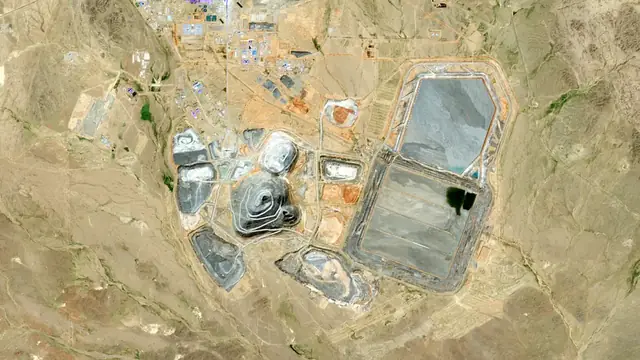
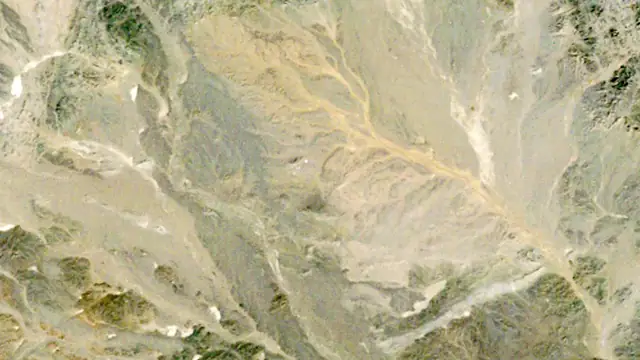 20251986Oyu TolgoiNothing for twenty-five years, then a whole mine in ten.1986 to 2025 · Mongolia
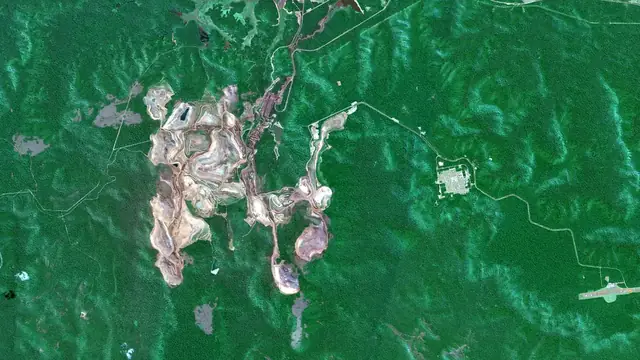
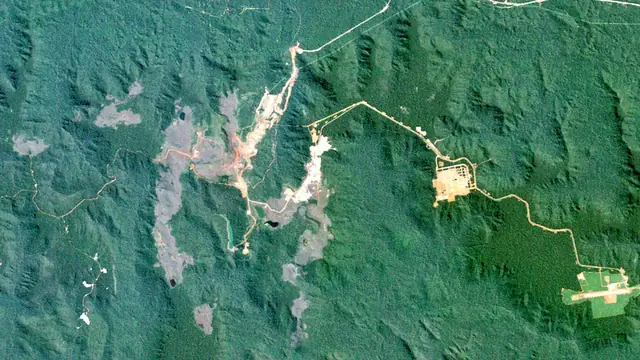 20251984CarajásRed iron pits open into the Amazon forest from 1984.1984 to 2025 · Brazil
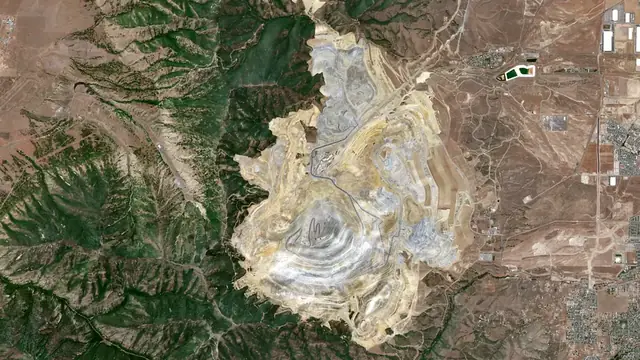
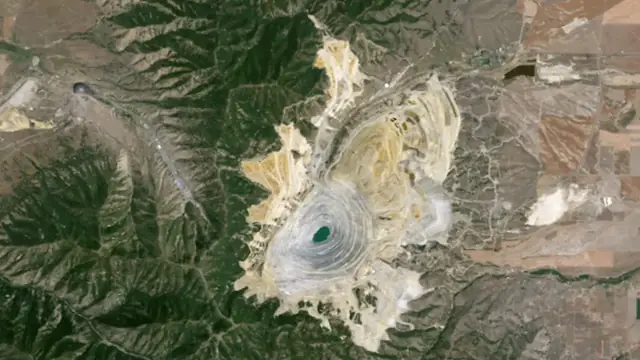 20261986Bingham CanyonMined since 1903 and still widening.1986 to 2026 · United States
Keep exploring
Keep exploring


All mining storiesThe world runs on rockAll mineralsMining by country
Cover photos from Wikimedia Commons: Super Pit, Kalgoorlie by Kgbo, CC BY-SA 4.0.