
Bingham Canyon, a century-old pit still growing, 1986 to 2026
Bingham Canyon was already one of the biggest holes on Earth when the first of these pictures was taken: mined since 1903, the first large open-pit copper mine in the United States. Slide forward and the pit keeps widening, the waste dumps climb the Oquirrh Mountains, and in 2013 the north-east wall slides into the bottom.
Forty years, frame by frame
One clear picture every five years, all on one grid, 17 km across. Pick a frame to open the viewer on it, drag the timeline, or press Play. Compare puts any two years side by side under a divider you drag.
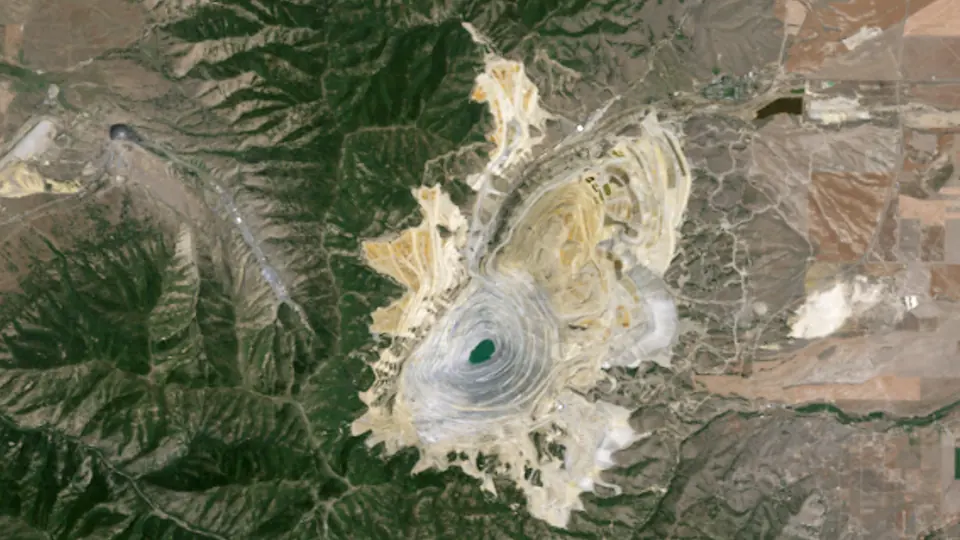 1985 · 17 Jul 1986
Landsat 5 · 16.5 km² worked
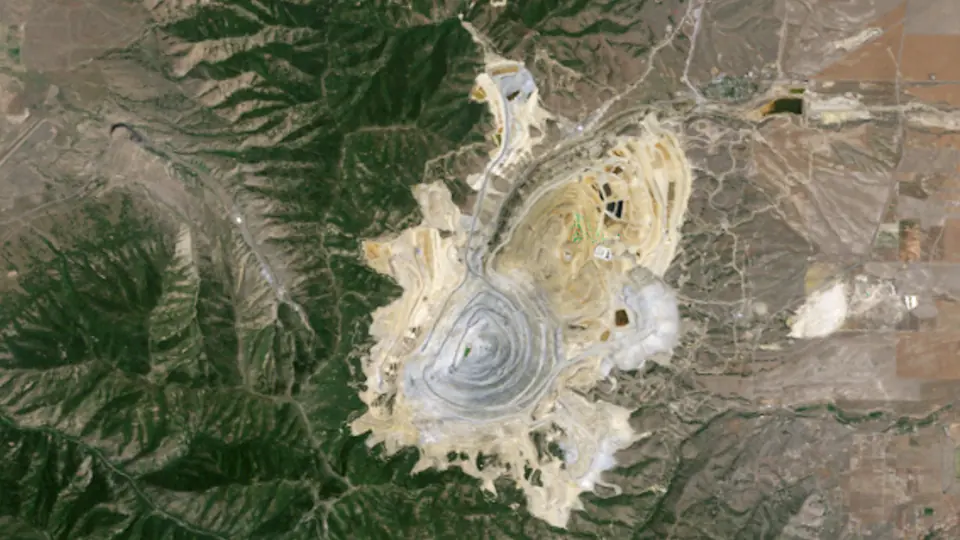 1990 · 15 Jul 1991
Landsat 5 · 17.1 km² worked
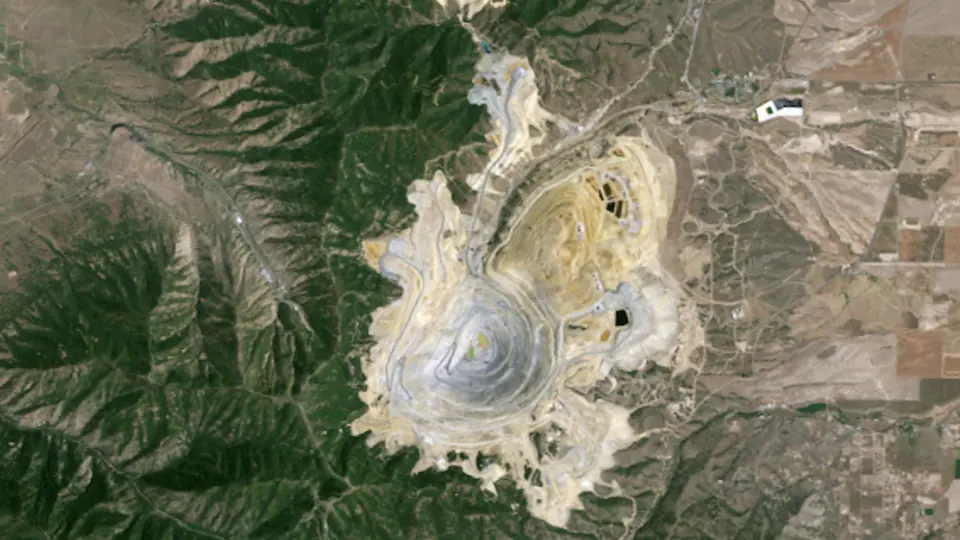 1995 · 26 Jul 1995
Landsat 5 · 18.2 km² worked
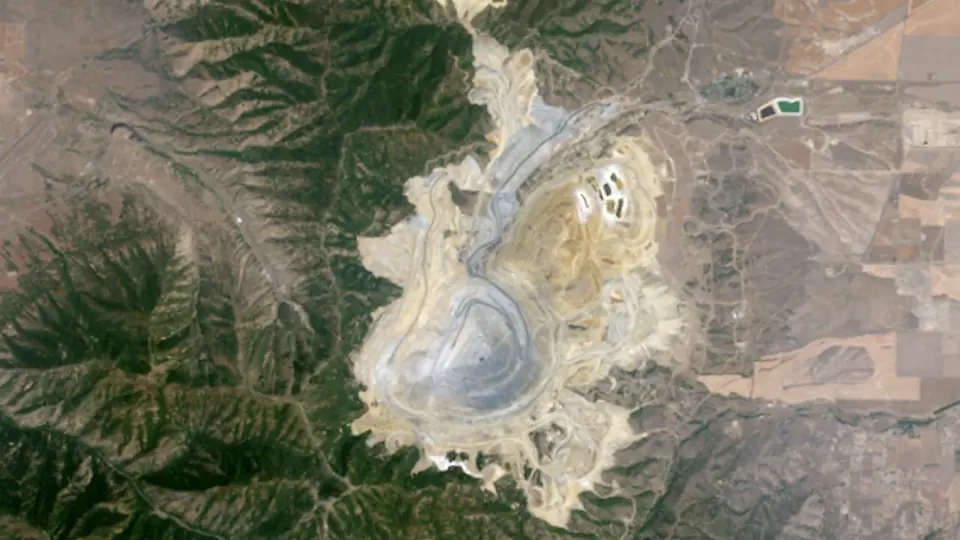 2000 · 31 Jul 2000
Landsat 7 · 20.0 km² worked
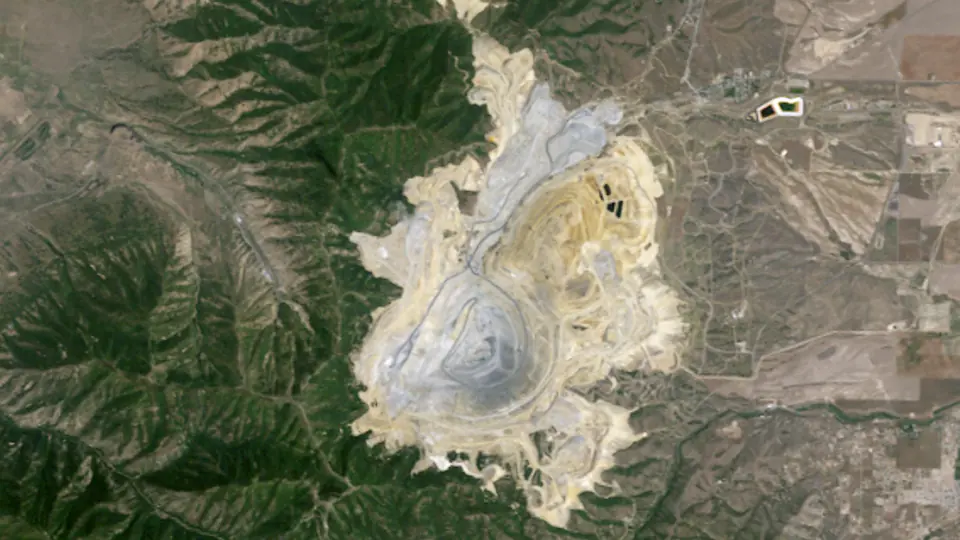 2005 · 5 Jul 2005
Landsat 5 · 20.6 km² worked
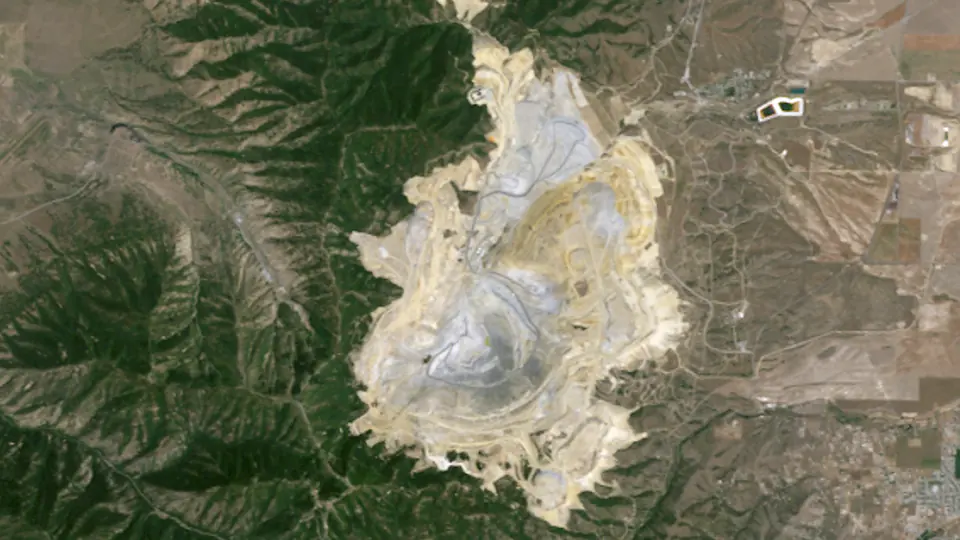 2010 · 22 Jul 2011
Landsat 5 · 22.0 km² worked
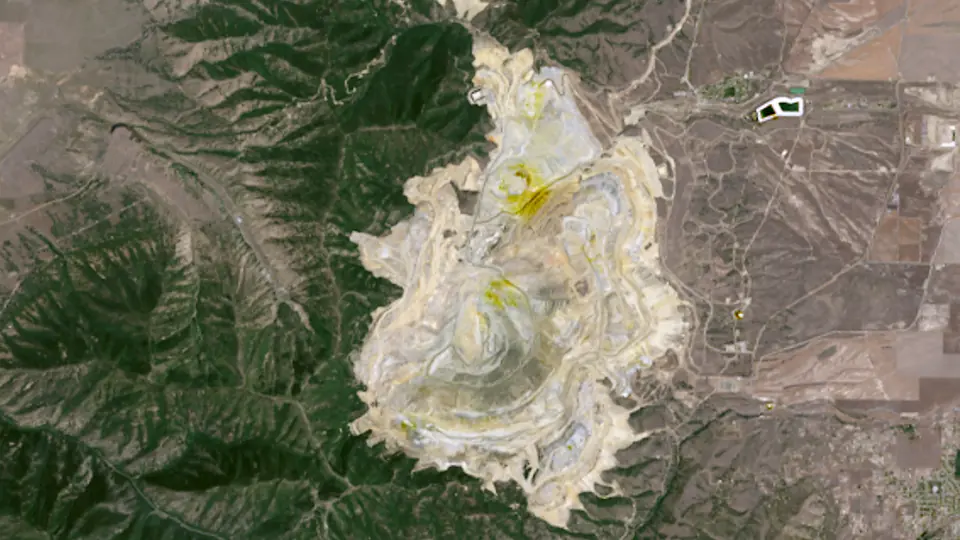 2015 · 14 Jul 2014
Landsat 8 · 23.7 km² worked
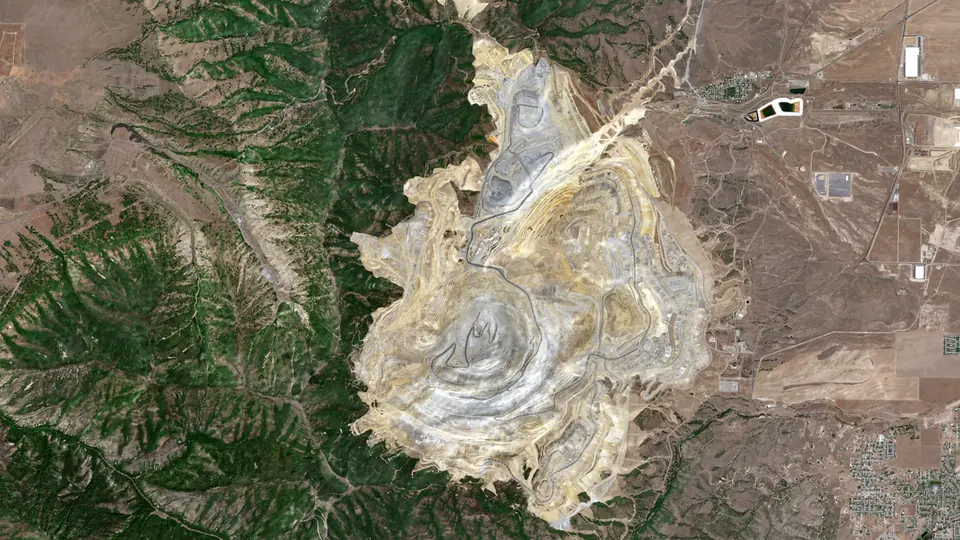 2020 · 31 Jul 2020
Sentinel-2A · 32.9 km² worked
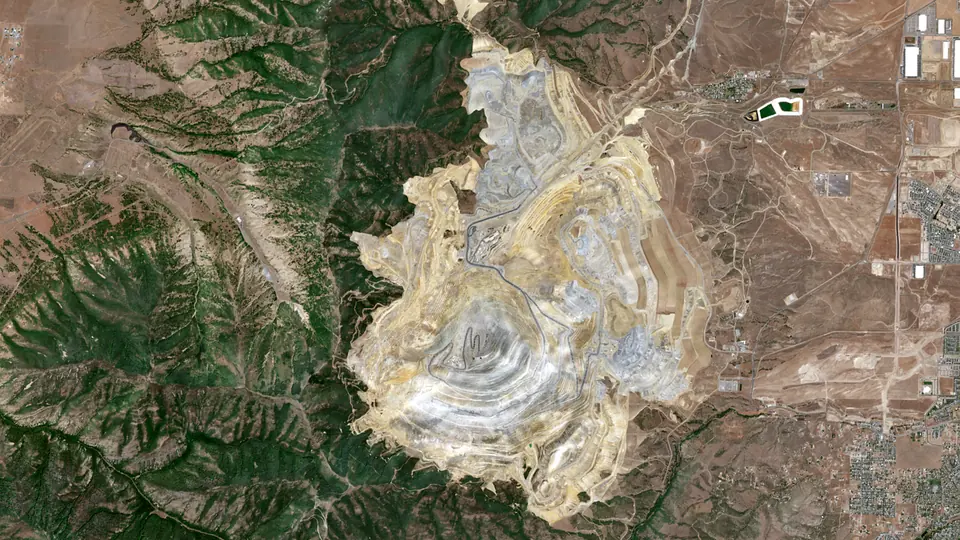 2025 · 30 Jul 2026
Sentinel-2C · 33.7 km² worked
What happened here
- 1863 The first claims. Wikidata records 1863 as the start of mining at Bingham Canyon. [1]
- 1903 The open pit begins. Daniel Jackling proved 50 million tons of ore grading 1.93 per cent copper, and Bingham became the first large open-pit mine and concentrator in the United States. It has been mined and processed since 1903. [2][3]
- 2013 The Manefay slides. On 10 April 2013 two landslides carried about 145 Mt of waste rock into the bottom of the pit. The Utah Geological Survey calls them the largest mining-induced landslides in history. No one was hurt. [4]
- 2025 133.6 kt of copper. Rio Tinto reports 133.6 kt of refined copper from Kennecott in 2025, down from 193 kt in 2024. [5]
More on the mine's history is on Bingham Canyon in the history of mining, and on the copper and molybdenum pages and mining in United States.
Copper output by year
Copper output from Bingham Canyon in the years with an open, mine-level figure: the Jasansky et al. open database of mine production (CC BY 4.0) and the operators' own filings. Years with no open mine-level figure are left out rather than estimated. The timeline under the pictures shows the same bars.
The figures
| Year | Output | Basis | Source |
|---|---|---|---|
| 2001 | 313 kt | contained copper | [6] |
| 2002 | 260 kt | contained copper | [6] |
| 2003 | 282 kt | contained copper | [6] |
| 2004 | 264 kt | contained copper | [6] |
| 2005 | 221 kt | contained copper | [6] |
| 2006 | 266 kt | contained copper | [6] |
| 2007 | 212 kt | contained copper | [6] |
| 2008 | 238 kt | contained copper | [6] |
| 2009 | 304 kt | contained copper | [6] |
| 2010 | 250 kt | contained copper | [6] |
| 2011 | 195 kt | contained copper | [6] |
| 2012 | 163 kt | contained copper | [6] |
| 2013 | 211 kt | contained copper | [6] |
| 2014 | 204 kt | contained copper | [6] |
| 2015 | 92.0 kt | contained copper | [6] |
| 2016 | 153 kt | contained copper | [6] |
| 2017 | 149 kt | contained copper | [6] |
| 2018 | 204 kt | contained copper | [6] |
| 2024 | 193 kt | refined copper, Kennecott | [5] |
| 2025 | 134 kt | refined copper, Kennecott | [5] |
Photos
Pictures from the ground and from orbit, openly licensed. The viewer slips each one in near its year.
How this was made
Pictures. Landsat 4 and 5 (to 2011), Landsat 7 (before its 2003 scan-line fault), Landsat 8 and Sentinel-2 (2017 on), surface reflectance read from Microsoft's Planetary Computer. For each frame we take the clearest picture within a year or so of the target year, in the same season where we can, checked against each scene's own cloud mask, and cut it to one grid. One colour stretch serves every frame, and each older frame is colour-matched to the newest over the whole picture, so a change in colour is mostly a change on the ground. Landsat pixels are 30 m and Sentinel-2 pixels 10 m, so the newest frames are sharper. The date of each picture shows under the year.
Worked ground is our own estimate from the pictures. Within a box drawn round the mine, leaving the towns out, a 30 m cell counts as worked once it has lost its vegetation or changed strongly in brightness and short-wave infrared against the first frame, and the next frame sees the same change. Ground stays worked once it is worked, small specks are dropped, and holes inside the footprint are filled. It traces pits, waste dumps, tailings and plant, but it can miss ground that looks like its surroundings and catch a road or a cleared paddock. Treat the areas as a guide, not a survey. The newest frame is from July 2026: the clearest summer picture near 2025. The pit was already large in 1986, so the outline starts with the ground worked by then.
Output and milestones. Each figure and fact is linked to its source below. We report what operators and governments published and do not estimate missing years.
Sources and credits
- Wikidata: Wikidata item Q2450901 (Bingham Canyon Mine: inception)
- Mining Foundation of the Southwest: Hall of Fame: Daniel Jackling
- Rio Tinto: Kennecott operation page
- Utah Geological Survey: Bingham Canyon's Manefay Landslides and the Future of the Mine
- Rio Tinto (SEC): Form 20-F for the year ended 31 December 2025
- Jasansky, Brauneis, Maus et al. (Vienna University of Economics and Business): Open database on global coal and metal mine production (Zenodo v1.0.3; paper: Scientific Data 2023)
Satellite pictures: USGS/NASA Landsat (public domain) and contains modified Copernicus Sentinel-2 data 2026, via Microsoft Planetary Computer, processed by Prospector Trails. Photos: Bingham, 1942: Andreas Feininger (1906–1999), Wikimedia Commons, Public domain; Bingham, 2012: David Ratledge, Wikimedia Commons, CC BY 4.0; Waste dumps, 2019: Farragutful, Wikimedia Commons, CC BY-SA 4.0. Not investment advice.


More time machines
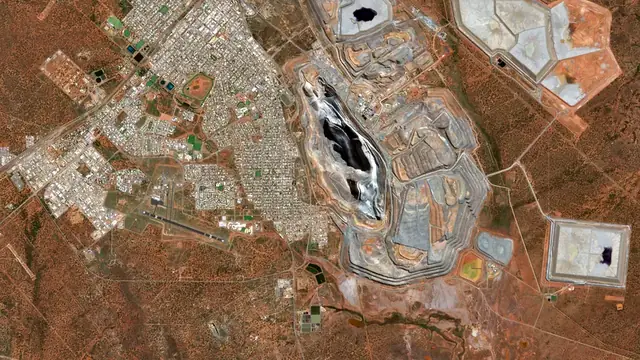
 20251986Kalgoorlie Super PitThe Golden Mile's old leases become one open pit, 3.5 km long.1986 to 2025 · Australia
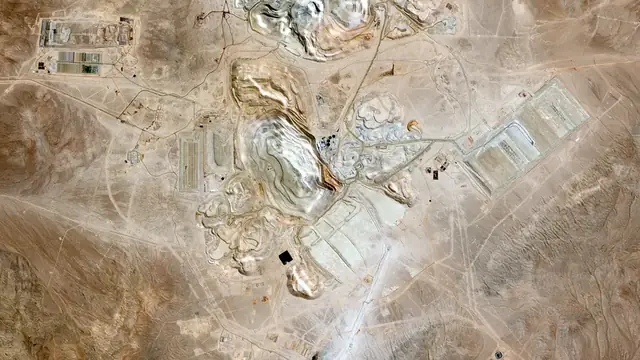
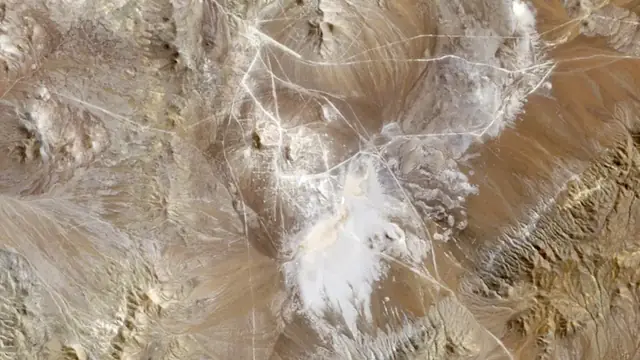 20251986EscondidaFrom an empty Atacama valley to the world's biggest copper mine.1986 to 2025 · Chile
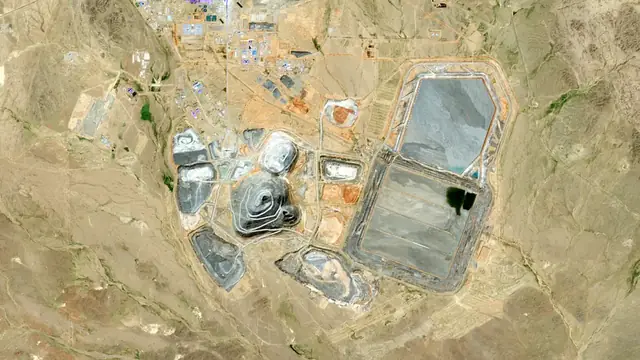
 20251986Oyu TolgoiNothing for twenty-five years, then a whole mine in ten.1986 to 2025 · Mongolia
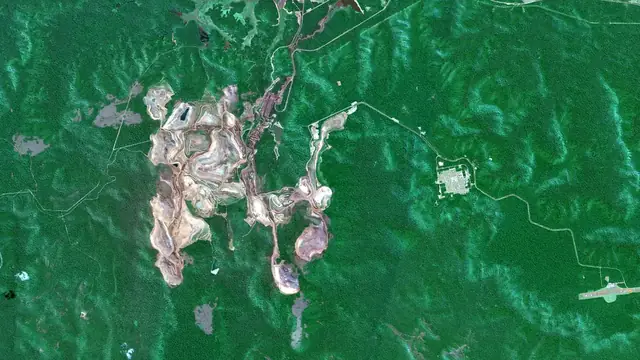
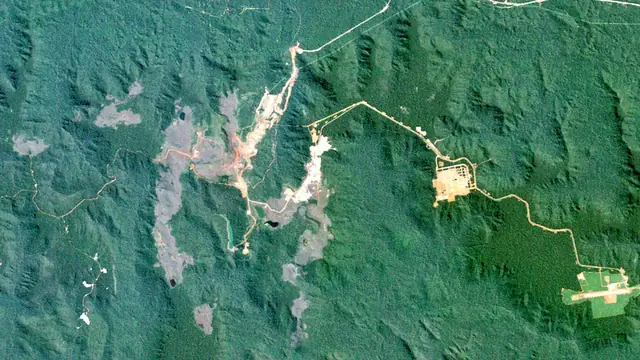 20251984CarajásRed iron pits open into the Amazon forest from 1984.1984 to 2025 · Brazil
Keep exploring
Keep exploring


All mining storiesThe world runs on rockAll mineralsMining by country
Cover photos from Wikimedia Commons: Haul trucks by Lechhabmed, CC BY-SA 4.0; Crushers by photosmith2011, Flickr, CC BY-SA 2.0; Ball mills and SAG mills by photosmith2011, Flickr, CC BY-SA 2.0. Pictures: Escondida Mine, Chile, NASA/GSFC/METI/ERSDAC/JAROS, and U.S./Japan ASTER Science Team (Public domain (NASA media, no copyright)).