

From shafts to open pits
Morenci Mine, AZ, NASA/GSFC/METI/ERSDAC/JAROS, and U.S./Japan ASTER Science Team (Public domain (NASA media, no copyright))
The numbers first. In 1900 the world produced 495,000 t of copper, by USGS records. In 2025 USGS estimates the world mined 23,000,000 t. That is more than 46 times as much.3,5
495,000 t
World copper production in 1900 (USGS)3
The change began with one idea, which we met in chapter 4. At Bingham Canyon in Utah, Daniel Jackling showed that very low-grade ore could pay if it was dug in bulk from an open pit and run through a large mill. He went on to apply the same scale at Chino and Ray.1
Arizona's Morenci shows the pattern. Miners worked underground there from the 1880s. In 1939 it became an open pit, and it has run without a break since. Freeport's share of its copper in 2025 was 497 million pounds.2
Machines made the scale possible. In the Union Minière open pits of Katanga, steam shovels cut the share of ore dug by hand from 90 per cent to 16 per cent in six years, up to 1923.6
The chart shows world copper output since 1900. The long climb is the story of open pits.3
World copper production, 1900 to 2020
World copper production rose from 495,000 tonnes in 1900 to 20,600,000 tonnes in 2020; the peak in this series is 20,600,000 tonnes in 2018. Basis: copper content.
Sources: Historical Statistics for Mineral and Material Commodities in the United States (Data…
In Chile, Codelco's 2018 report called the open pit at Chuquicamata the largest in the world. You can read how it went underground in our story on the biggest copper mines.7

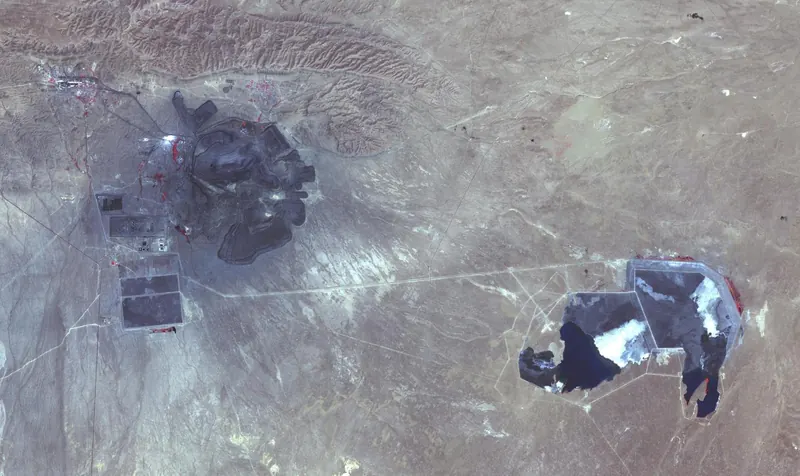
Norilsk and Muruntau: Soviet giants
Norilsk, Siberia, NASA/GSFC/METI/ERSDAC/JAROS, and U.S./Japan ASTER Science Team (Public domain (NASA media, no copyright))
Some giants were built by force. A Soviet decree of 23 June 1935 launched the construction of a nickel complex at Norilsk, in the far north of Siberia. Between 1935 and 1953 about a third of a million Gulag prisoners built and worked it.12,13
The prize was enormous. The area holds more than a third of the world's nickel reserves and about 40 per cent of its platinum reserves.12
1/3 million prisoners
Gulag prisoners who built and worked Norilsk, 1935 to 195312
Norilsk is still working. In 2019 its Polar Division mined 18.42 Mt of ore, 5.37 Mt of it from the Oktyabrsky mine. USGS says the company produced 99.3 per cent of Russia's marketable cobalt in 2020 and 2021.14,15
Far to the south, in the Kyzylkum Desert of Uzbekistan, geologists found gold at Muruntau in 1958. Open-pit mining by the Navoi combine began in 1969. Muruntau became one of the biggest open-pit gold mines on earth, and the state combine made about 80 per cent of Uzbekistan's gold.8,9
In Yakutia, the Mir diamond pipe was found on 13 June 1955. Its open pit, which we met in chapter 6, ran until 2001. The Udachnaya pipe, found the same year, was worked as an open pit from 1971 to 2015 and now goes on underground.10,16

The Carlin Trend: invisible gold
Goldstrike Mine, Nevada, NASA/METI/AIST/Japan Space Systems, and U.S./Japan ASTER Science Team (Public domain (NASA media, no copyright))
For decades the gold price did not move. From 1934 the United States paid 35 dollars an ounce. On 15 August 1971 President Nixon closed the gold window, and gold lost its fixed dollar price.17,19
New methods appeared too. USGS says heap leaching with cyanide was proposed in 1969 as a way to treat low-grade ore. Crushed ore is piled on a lined pad and sprayed with a solution that trickles through and carries the metal out. See heap leach in our glossary.24,25
In Nevada, these changes met the Carlin Trend. Newmont explored the trend from 1961, and open-pit mining began at Carlin in 1965. The Gold Quarry and Rain deposits were found in 1980, and 10 more by 1988.20,21
Goldstrike, nearby, took longer to show what it held. Atlas Minerals first found gold there in 1962, and PanCana first mined it in 1976. The big deposits came later: Deep Post in 1986, and Betze and Screamer in 1987 and 1988. Barrick took control on 31 December 1986 and full ownership in January 1987.21
Since 1 July 2019 Goldstrike and Carlin have been run together as part of Nevada Gold Mines. Barrick's 61.5 per cent share of Carlin was 775 koz of gold in 2024.20
World gold output reflects these changes. USGS records 1,480 t in 1970, 2,180 t in 1990 and 3,050 t in 2020.23
World gold production, 1900 to 2020
World gold production rose from 386 tonnes in 1900 to 3,050 tonnes in 2020; the peak in this series is 3,310 tonnes in 2018. Basis: fine gold, world mine output.
Sources: Annual Report of the Director of the Mint for the fiscal year ended June 30, 1915…; Annual Report of the Director of the Mint for the fiscal year ended June 30, 1915…; Historical Statistics for Mineral and Material Commodities in the United States (Data…
USGS estimates the world mined 3,300 t of gold in 2025, led by China, Russia and Australia. Our gold mines page lists the largest today.5

The Super Pit at Kalgoorlie
Kalgoorlie-Boulder, Australia, NASA/JPL-Caltech (Public domain (NASA media, no copyright))
Old fields could become giants too. At Kalgoorlie in Western Australia, Paddy Hannan, Thomas Flanagan and Dan Shea found about 100 oz of alluvial gold at Mount Charlotte in June 1893. As we saw in chapter 5, a rush followed, and mines such as Great Boulder and Ivanhoe were pegged along the Golden Mile.26,27
In the 1980s Alan Bond bought leases there, but his company did not finish combining them. The leases were finally joined in 1989, and a single company was formed to work them as one open pit: the Super Pit.26
By 2015 the pit was about 3.5 km long, 1.5 km wide and more than 600 m deep. It poured its 16 millionth ounce of gold from Fimiston in March 2014. The Golden Mile as a whole has produced about 58 Moz.26
58 Moz
Gold produced by Kalgoorlie's Golden Mile since 189326
Size is not the same as output, though. In 2021 USGS put the Super Pit fourth among Australian gold mines with 15,200 kg, behind Boddington with 21,600 kg, Cadia East with 18,600 kg and Fosterville with 15,900 kg.28

Escondida mine: the hidden one
Escondida Mine, Chile, NASA/GSFC/METI/ERSDAC/JAROS, and U.S./Japan ASTER Science Team (Public domain (NASA media, no copyright))
The largest copper mine in the world was found under ground that showed nothing. In 1981 Utah International began exploring the Quebrada Escondida, south-east of Antofagasta in the Atacama Desert of Chile.29
The decisive moment came with drill hole 23. Below 300 m of barren cover, it hit a zone of secondary enrichment rich in the copper minerals chalcocite and bornite. Our guide to exploration drilling explains how holes like this are planned.29
Production began in 1990. Today Escondida has two open pits feeding three concentrators and two leaching operations. BHP reports 1,261 kt of copper from it in the year to June 2026, on a 100 per cent basis, and 1,305 kt the year before.30
1,261 kt
Escondida copper output, year to June 2026 (100% basis)30
Chile has other giants. Collahuasi, owned by Anglo American, Glencore and a Japanese group, made nearly 10 per cent of Chile's mined copper in 2019. Chile mined 5,300 kt of copper in 2025, more than any other country.5,33
In Peru, Cerro Verde near Arequipa has been working since the 1970s. A Phelps Dodge predecessor bought it from the Peruvian government in 1994. In 2025 it produced 863 million pounds of copper.2

Grasberg and the move underground
Earth observation taken by the Expedition 11 crew, NASA JSC (Public domain (NASA media, no copyright))
In Papua, Indonesia, the Ertsberg outcrop that Dozy described in 1936 became a mine in 1972, as told in chapter 10. The bigger prize, Grasberg, was found nearby in 1988.2,34
The Grasberg open pit ran from 1990 to 2019. In that time it produced over 27 billion pounds of copper and 46 Moz of gold. Then mining went underground, by block caving. In this method a large block of ore is undercut so that it breaks and falls under its own weight, to be drawn off from below.35,38
Underground giants have their own risks. In 2025 Grasberg produced 1,015 million pounds of copper and 937 koz of gold. That was well below 2024 after a mud rush in September 2025.2
In Mongolia, Ivanhoe began exploring Oyu Tolgoi in 2000, and Rio Tinto took majority control in 2012. Open-pit mining started in 2011. Underground mining, through shafts about 1.3 km deep, reached sustainable production in March 2023. In 2025 the mine produced 345 kt of copper in concentrate.36,37
The man behind Ivanhoe, Robert Friedland, came to mining by an odd route. A 1978 inspection of a gold mine held in partnership with Steve Jobs turned up only pyrite. It started his mining career. His motto was short.37
stake to the horizon
Ivanhoe's 2009 find at Kamoa, in the Democratic Republic of the Congo, is described as the country's largest copper discovery in a century. Kamoa-Kakula produced 388,838 t of copper in concentrate in 2025.31,37

Giant companies, and the end of a mine
Diavik Mine, Canada, NASA/METI/AIST/Japan Space Systems, and U.S./Japan ASTER Science Team (Public domain (NASA media, no copyright))
As the mines grew, so did the companies. Rivals that had competed side by side in Nevada pooled their mines. Since 1 July 2019 Goldstrike and Carlin have been run together under Nevada Gold Mines, in which Barrick holds 61.5 per cent.20,21
In Australia, Newcrest acquired Cadia in New South Wales in 1991 and Lihir in Papua New Guinea in 2010. In 2023 Newmont bought Newcrest and took full ownership of both. Cadia is mined by block caving, and two new panel caves are being built. Lihir, on Aniolam Island about 900 km north-east of Port Moresby, produced 585 koz of gold in 2025.39,41
Newmont also owns all of Boddington, 130 km south-east of Perth, having bought the last 33.33 per cent from AngloGold Ashanti Australia in June 2009. In 2021 USGS ranked it Australia's top gold mine.41
Some giants have new kinds of owner on the land. Red Dog, a zinc and lead mine in the DeLong Mountains of Alaska, began production in 1989. Teck runs it on land leased from the NANA Regional Corporation, an Alaska Native corporation that receives a share of net proceeds.42
Every mine ends. Diavik, a diamond mine on Lac de Gras in Canada's Northwest Territories, was built after four kimberlite pipes were found in 1994 and 1995. Diamond production started in 2003. Rio Tinto gave its life as running through early 2026, and its 2025 report notes the pending closure.32,43
In Western Australia, the last day of mining at Argyle was 3 November 2020, after 37 years. About 2,000 ha of land had to be rehabilitated, and closure works were expected to finish in 2026.40
37 years
Life of the Argyle diamond mine, to 3 November 202040
As we saw with Ranger in chapter 9, closing a giant can take years of work. Our lesson on discovery to production looks at the long timelines at the other end of a mine's life.44

Mapping the giants
Earth Observations taken by the Expedition 15 Crew, NASA JSC (Public domain (NASA media, no copyright))
There is no single way to rank a mine. De Beers calls Orapa in Botswana the largest open-pit diamond mine in the world by area, and Jwaneng the richest by value. Codelco called Chuquicamata the largest open pit. Escondida is called the largest copper mine in the world for the metal it produces. Each measure gives a different list. The map below shows the giants in this chapter, and the picture shows Bingham Canyon from space.7,29,70
- Escondida1990
- Collahuasi
- Cerro Verde
- Grasberg minerals district1972
- Oyu Tolgoi2011
- Kamoa-Kakula
- Muruntau1969
- Norilsk-Taimyr (Nornickel)
- Mir diamond mine1957
- Kalgoorlie1989
- Carlin (Nevada Gold Mines)1965
- Goldstrike (Nevada Gold Mines)1976
- Morenci1939
- Bingham Canyon1903
- Cadia
- Lihir
- Boddington
- Red Dog1989
- Diavik2003
- Argyle diamond mine
- Construction of Norilsk combine begins1935
- Escondida porphyry copper found1981
- Manefay landslides at Bingham Canyon2013
- Ottawa Accords steer Northern Rhodesian copper to Britain
Preferential access to British markets meant most Northern Rhodesian copper went to Britain.6,46
- Katanga declares its secession from Congo
The copper-rich province broke away as an unrecognised state (Wikidata date).47
- China agrees to fund TAZARA with US$415 million
A tripartite agreement signed in Beijing started surveys of the line.48,49,50
- Copper is 97 per cent of Zambias foreign exchange earnings
The dependence made a safe export route a political priority.48,51
- Chile nationalises large copper mining
- Panguna mine: inception
Panguna mine: inception.56
- Olympic Dam drill hole RD1
- Roros Mining Town inscribed
UNESCO World Heritage listing event.59
- Panguna mine halted
- Rammelsberg and Goslar inscribed
UNESCO World Heritage listing event.62
- Falun Great Copper Mountain inscribed
UNESCO World Heritage listing event.63
- Berkeley Pit cleanup settlement
The EPA called it the nation's largest body of contaminated water.64,65
- Glencore completes merger with Xstrata
The merger joined a large trading house with a large mining group.66,67
- Mount Polley tailings dam breach
The panel reported on 30 January 2015 and made recommendations to reduce the chance of tailings failures.68,69
The scale brings new kinds of event. On 10 April 2013 two landslides carried about 145 Mt of waste rock into the Bingham Canyon pit. The Utah Geological Survey calls them the largest mining-induced landslides in history. No one was hurt. The survey notes that Kennecott had a network of geotechnical monitors in place. For more giants, see our ranking of the largest mines in the world.71
Next: the new rush
The giants were built for copper, gold and iron. But the twenty-first century wanted other metals as well: lithium, cobalt, nickel and rare earths, for batteries and magnets. A new kind of rush began. Read on in chapter 12: the new rush.5,37


