

Lithium from brine: Searles Lake and Clayton Valley
Clayton Valley, NV, NASA/METI/AIST/Japan Space Systems, and U.S./Japan ASTER Science Team (Public domain (NASA media, no copyright))
Lithium was named for stone. It takes its name from the Greek lithos, because it was first found in a mineral rather than in plant ash. In 1817 Johan August Arfvedson showed that petalite, a mineral from the Swedish island of Utö, held a new metal.1
USGS says the earliest lithium produced from brine came in 1938, as a by-product at Searles Lake in California. A larger deposit in Clayton Valley, Nevada, began production in 1966.2
That operation, at Silver Peak, is still running. Albemarle describes it as continuous lithium brine production since 1966. It is the only commercial lithium brine operation in the United States.6,7

Lithium comes from two very different kinds of deposit. One is salty brine, pumped from closed desert basins and evaporated. Producing brines average 160 to 1,400 parts per million of lithium. The other is hard rock: pegmatites, very coarse-grained granites that hold the lithium mineral spodumene.3,4
The largest brine fields lie in the Salar de Atacama in Chile, high in the desert we visited at Escondida in chapter 11. SQM says its Chilean lithium carbonate capacity reached 180,000 t a year after expansions in 2022.8


Greenbushes: from a tin field to a lithium giant
The hot desert coast of Western Australia's Pilbara region, NASA JSC (Public domain (NASA media, no copyright))
The story of hard-rock lithium starts with tin. In 1886 the Government Geologist of Western Australia, Edward Hardman, reported tin at Greenbushes. In 1888 David Stinton found a tin field there, and alluvial miners rushed in.9,15
Greenbushes kept going as the market changed. Tantalum was mined from 1942. A tantalum market only existed after the tantalum filament lamp was invented in 1905. Exploration in the 1970s found a pegmatite 5 km long, holding tin, tantalum and spodumene.9,10
Lithium production began in 1983. By 30 June 2025 the mine had produced 37.1 Mt of spodumene concentrate. Talison calls the area the longest continuously operated mining area in Western Australia. In 2023 it gave 51 per cent of the state's lithium output.10,11
37.1 Mt
Spodumene concentrate produced at Greenbushes to 30 June 202511
Hard-rock lithium spread north to the Pilbara, the iron country of chapter 8. Pilgangoora produced 221.3 kt of spodumene concentrate in the June 2025 quarter and 224.8 kt in the September quarter.16
The chart shows Australian lithium output from the first years of Greenbushes. It rose from 512 t in 1986 to 7,916 t ten years later.12
Australia lithium production, 1985 to 2021
Australia lithium production rose from 721 tonnes in 1985 to 55,000 tonnes in 2021; the peak in this series is 58,800 tonnes in 2018. Basis: contained lithium in spodumene concentrate (t Li).
Sources: A Comprehensive Dataset for Australian Mine Production, 1799 to 2021 (v1.4b, Tab04…; U.S. Geological Survey Mineral Commodity Summaries 2024 Data Release - world.zip…; U.S. Geological Survey Mineral Commodity Summaries 2025 Data Release (ver. 2.0, April…; Mineral Commodity Summaries 2026 Data Release - MCS2026_Commodities_Data.csv (world…

The lithium boom of 2016 to 2023
A lithium extraction facility in Bolivia's Salar de Uyuni, NASA JSC (Public domain (NASA media, no copyright))
Batteries changed everything. In 2000 the world produced 14,100 t of lithium. USGS estimates 290,000 t for 2025, and batteries now take about 88 per cent of lithium use.5,17,18
Prices tell the story of the boom. USGS put the US average price of battery-grade lithium carbonate at 8,650 dollars a tonne in 2016 and 15,000 dollars in 2017. After a fall to 8,600 dollars in 2020, the 2022 average reached 68,100 dollars. In 2023 it fell to 46,000 dollars.19,21
68,100 US$/t
Average US lithium carbonate price in 2022, the peak of the boom (USGS)21
Even the price is hard to pin down. USGS gave 37,000 dollars for 2022 in its 2023 edition, then 68,100 dollars in its 2024 edition, after changing its price source. Historians of any boom should check which series a number comes from.21,23
Western Australia felt the boom most. Its lithium sales rose from 8.0 billion Australian dollars in 2021-22 to 20.9 billion in 2022-23. China took 99 per cent of the state's lithium exports by value in 2023.20
Money flowed into new companies. On 23 June 2022 Leo Lithium began trading on the Australian stock exchange, having raised just over 100 million Australian dollars to develop the Goulamina project in Mali.24
Then came the bust. Wodgina had been idled in 2019 and restarted in 2022. Mt Cattlin was placed on care and maintenance by the end of March 2025. Western Australia's lithium royalty receipts fell by 64.89 per cent in 2024-25, from 710.17 million to 249.33 million Australian dollars.20,31,32,33
The boom changed the size of the industry. World lithium supply rose from about 35,000 t of lithium content in 2013 to about 180,000 t in 2023, by the Western Australian government's figures.20
New producers kept arriving even as prices fell. USGS says two lithium mines in Mali started in 2024, and Mali's output rose from 770 t in 2024 to an estimated 9,400 t in 2025. Australia mined 92,000 t in 2025, China 62,000 t and Chile 56,000 t.5,34
In Bolivia, the state kept control. A law of April 2017 created the state lithium company YLB, under COMIBOL, the company that took over the tin mines in chapter 10. The picture shows a lithium plant on the Salar de Uyuni.35
2016 to 2023 lithium boom
- Price start (2016)8,650 US dollars per tonne, lithium carbonate annual average19USGS MCS 2020 (US large-contract price)
- Price 2017 (2017)15,000 US dollars per tonne, lithium carbonate annual average19USGS MCS 2020
- Price trough (2020)8,600 US dollars per tonne, lithium carbonate annual average21USGS MCS 2024 series
- Price peak (2022)68,100 US dollars per tonne, lithium carbonate annual average21USGS MCS 2024. The MCS 2023 edition gave 37,000 for 2022 with a different price source.
- Price end (2023)46,000 US dollars per tonne, lithium carbonate annual average21USGS MCS 2024. WATC gives US$45,363 from S&P/Benchmark data.
- Spodumene spot 2021 (2021)450 to 2300 US dollars per tonne (6% Li2O, c.i.f. China), January to November22USGS MCS 2022
- Spodumene spot 2022 (2022)4900 to 5800 US dollars per tonne (6% Li2O, c.i.f. China), January to November23USGS MCS 2023
- Spodumene spot 2023 (2023)6000 to 2500 US dollars per tonne (6% Li2O, Australia f.o.b.), January to November21USGS MCS 2024
- Wa lithium sales before (2022)8 billion Australian dollars20Financial year 2021-22
- Wa lithium sales peak (2023)20.9 billion Australian dollars20Financial year 2022-23
- Wa lithium exports (2023)18.4 billion Australian dollars (up 52 per cent)20Calendar year 2023
- World lithium supply (2023)180,000 tonnes of lithium content (from 35,000 in 2013)20WATC; USGS gives 146,000 for 2022 and about 180,000 for 2023
- Australia mine production86,000 tonnes of lithium content (2023 estimate; 58,800 in 2018)21USGS MCS 2024 and MCS 2020
- Australia mineral operations among majority of output4 to 6 operations, varying by year (6 in 2019, 5 in 2020, 4 in 2021, 6 in 2022)23Count of Australian mineral operations USGS names as making up most world output; it is not a count of new mines. Opening dates for new mines were not sourced.
- Capital raised example (2022)100,041,906 Australian dollars before costs (Leo Lithium IPO)24One company only. No ASX or government sector total was found; left as a gap.
- Mine restart (2022)Wodgina trains 1 and 2 restart after care and maintenance20
Victorian gold rush
- First discovery clunes1850-0325Hon. W. Campbell at Clunes, "probably" first
- Rush notification1851-07-0525Gold notified in the Yarra Ranges and the Pyrenees
- Commonwealth population 1851 (1851)437,665 people25Australia end of 1851
- Commonwealth population 1861 (1861)1,168,149 people25Australia end of 1861
- People who came (1861)40,000 people per year, average25"Over 40,000" a year reached Victoria 1851 to 1861
- Years as top australian producer (1898)47 years25Victoria led until Western Australia passed it in 1898
- Victoria gold 1901 (1901)730,450 fine ounces25ABS table
- Deaths at the Eureka Stockade (1854)28 people26Six police and troopers and at least 22 diggers, State Library Victoria
- Peak year185625Victoria's highest yearly gold output
Hannan finds gold at Kalgoorlie
- Coolgardie find (1892)554 ounces27Bayley, September 1892
- Bayleys reward output (1962)500,000 ounces over about 70 years27"over 500,000 ounces"
- Goongarrie alluvial1893-0525ABS Year Book
- Kalgoorlie discovery1893-0628Hannan and Flanagan
- Wa gold output (1901)1,703,417 fine ounces25ABS table
- Wa gold output peak (1903)2,064,803 fine ounces25Peak for WA and for Australia
- Wa share of australian gold53.15 percent, 1901 to 1909 annual average25ABS table
- Water pipeline length (1903)566 kilometres29Goldfields Water Supply Scheme, built 1898 to 1903
- Water pipeline cost then2,500,000 pounds (debate figure of 1898)30"two and a half million pounds" quoted in the Assembly debate, WA Museum
How does the lithium rush compare with the gold rushes of chapter 5? The table sets them side by side. The gold rushes moved people: over 40,000 a year reached Victoria in the 1850s. The lithium boom moved money. Our lesson on the gold rush and the lithium rush goes further.20,25
Cobalt and the Congo
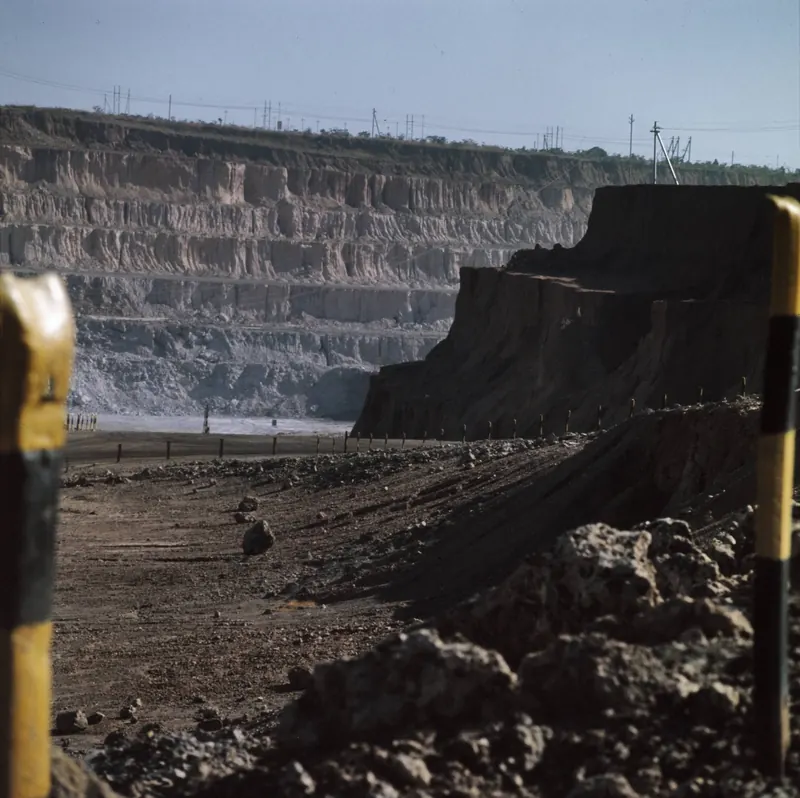
Zaire (voorheen Belgisch Congo ); kopermijn de Kolwezi, Mieremet, Rob / Anefo / Europeana (Public Domain Mark 1.0)
Cobalt has an old miners' name. It comes from the German Kobold, a goblin. Miners used the word for ores that gave trouble and no copper. Georg Brandt identified the metal in 1739.1
As we saw in chapter 10, the Shaba invasions of 1977 and 1978 caused a panic in the cobalt market. In the new century, batteries made cobalt matter again. A USGS study found that the Democratic Republic of the Congo's cobalt mine output rose from 11,000 t in 2000 to 98,000 t in 2020. Over the same years, cobalt demand for batteries grew 26-fold.36,38
Much of the early growth came from hand digging. Artisanal miners produced 40 to 53 per cent of Congo's cobalt around 2008. By 2020 their share was 9 to 11 per cent, as large mines took over.36
USGS estimates the world mined 310,000 t of cobalt in 2025, and 230,000 t of it came from the Congo. The ore is processed into intermediates such as cobalt hydroxide and exported, and China is the leading refiner. In February 2025 the Congo temporarily banned cobalt exports to deal with oversupply and low prices.5,39
230,000 t
Cobalt mined in the Democratic Republic of the Congo in 2025, of 310,000 t worldwide (USGS)5
Price swings reach individual mines quickly. Glencore's Mutanda mine produced 103,200 t of copper in 2019, then went to care and maintenance at the end of that year because of low cobalt prices. Our guide to the battery shows where the cobalt goes.40
Nickel followed a similar path in Indonesia after its 2020 export ban, as told in chapter 10. Indonesia's cobalt output, a by-product of nickel, rose from 1,100 t in 2020 to an estimated 44,000 t in 2025.5,41

Rare earths: Mountain Pass, Bayan Obo and Mount Weld
Mountain Pass Mine, California, NASA/GSFC/METI/ERSDAC/JAROS, and U.S./Japan ASTER Science Team (Public domain (NASA media, no copyright))
The rare earths began with a Swedish quarry. Yttrium, the first rare earth identified, is named after Ytterby in Sweden, where the first rare-earth mineral was found. Johan Gadolin identified it in 1794.1
For much of the twentieth century the leading mine was in California. Mountain Pass began mining rare earths in 1952. USGS says low prices and permitting problems stopped mining there from 2002 to 2011. That pause left China with over 90 per cent of world rare earth production.42,44
Much of China's supply came from Bayan Obo in Inner Mongolia. As we saw in chapter 8, it was first found as an iron deposit in 1927. USGS calls it the world's largest known rare earth deposit.47
In July 2010 China set the second part of its rare earth export quota at 7,976 t, against 26,427 t a year earlier. Actual exports in 2010 were 20,258 t, down 40 per cent. USGS says rare earth prices rose sharply.43
40% fall
Drop in China's rare earth exports in 2010 after export quota cuts (USGS)43
Other governments pushed back. On 13 March 2012 the United States asked for consultations at the World Trade Organization over China's export limits on rare earths, tungsten and molybdenum. The European Union and Japan filed parallel cases.48
New mines opened outside China. Lynas began producing rare earth concentrate at Mount Weld in Western Australia in 2011, though shipments waited until 2013 for its plant in Malaysia. In 2025 the group produced 10,462 t of rare earth oxide.42,49
Mountain Pass had a harder road. Molycorp restarted it in 2012 with a planned capacity of 19,000 t a year, but idled it in 2015 when prices fell. MP Materials bought the site in July 2017. In 2025 it produced 50,692 t of rare earth oxide in concentrate.42,44
Why the fuss? Magnets are now the largest use of rare earths. The IEA estimated in 2021 that the motor of a permanent-magnet electric car holds about 0.25 to 0.50 kg of neodymium.45,46
Even so, USGS estimates China mined 270,000 t of the world's 390,000 t of rare earth oxide in 2025. Our guide to the magnet explains what rare earths do in a motor.5
Old rushes, new rush
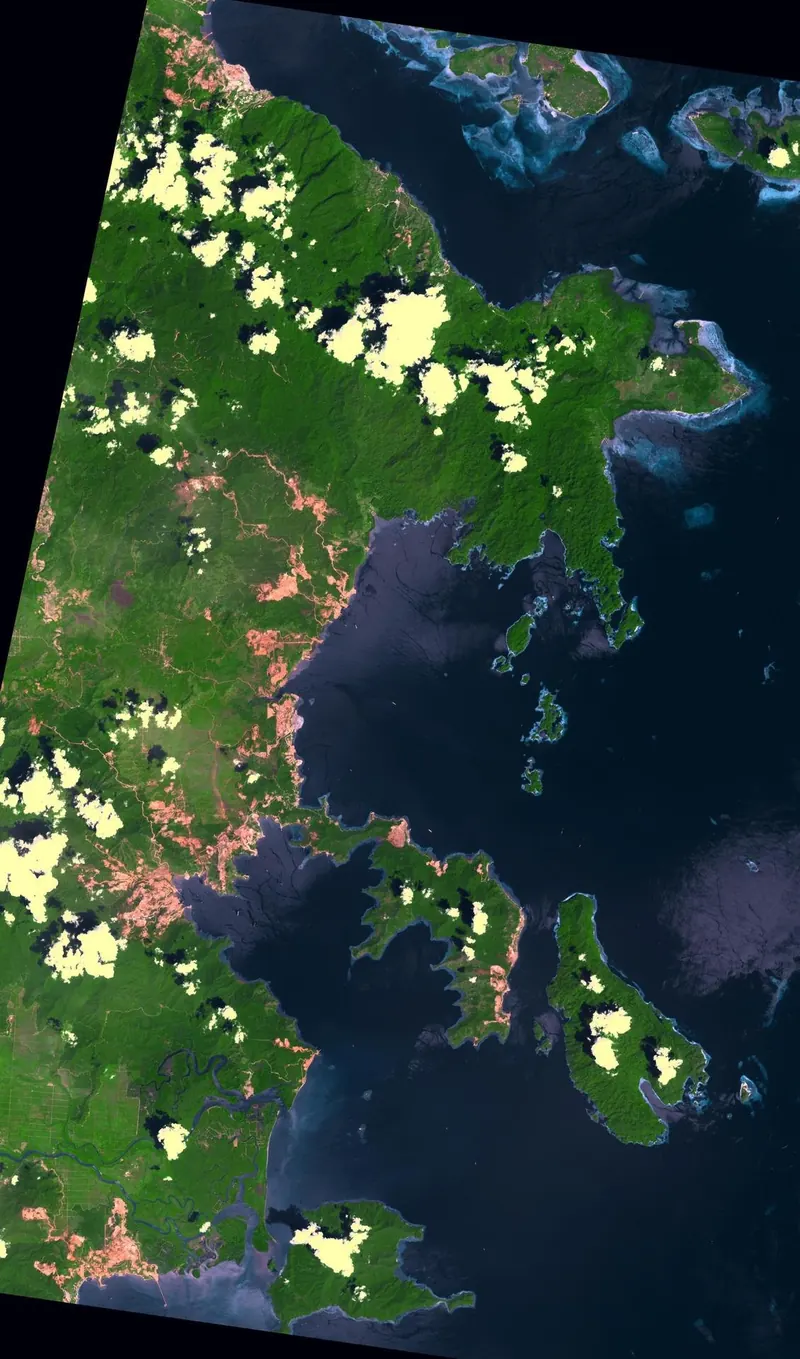
Sulawesi, Indonesia, NASA/METI/AIST/Japan Space Systems, and U.S./Japan ASTER Science Team (Public domain (NASA media, no copyright))
The phrase critical minerals grew out of supply scares like the cobalt panic of 1978. USGS says that shock made Western governments worry about cobalt from central Africa, and it still shapes the debate. See our critical minerals section for the metals on today's lists.57
Governments now lend money to build mines. In Nevada, the Thacker Pass lithium clay project is backed by a 2.26 billion US dollar loan from the US Department of Energy. Its owner aims to complete the first phase in late 2027.50
The big miners came back into lithium too, buying rather than finding. Rio Tinto completed its purchase of Arcadium Lithium in March 2025. That gave it a controlling share of Olaroz, a brine operation on a salt pan in Jujuy province, Argentina, which made record lithium carbonate in 2025. It is the same pattern of mergers we saw among the gold giants in chapter 11.32,58
The ore in the ground is spread more widely than the mines. USGS puts world lithium reserves at 37,000,000 t. Chile holds 9,200,000 t, Australia 8,400,000 t, China 4,600,000 t and the United States 4,400,000 t.5
Graphite, the other big battery mineral, has its own geography. Balama in Mozambique produced 67 kt in 2025. But China mined 1,400,000 t of the world's 1,800,000 t of natural graphite that year.5,59
- Silver Peak1966
- Salar de Atacama (SQM / Nova Andino Litio)
- Olaroz
- Greenbushes1888
- Pilgangoora
- Wodgina
- Thacker Pass
- Goulamina
- Mountain Pass1952
- Bayan Obo
- Mount Weld
- Tenke Fungurume (TFM)
- Mutanda
- Balama
- Congolese cobalt to China
- Australian spodumene to China
- Lithium brine production begins at Clayton Valley1966
- Greenbushes lithium production begins1983
- China cuts rare earth export quota2010
- Lynas starts Mount Weld concentrate production2011
- Indonesia bans nickel ore exports2020
- Lithium brine production begins at Clayton Valley
- Greenbushes lithium production begins
Greenbushes is still a major lithium mine in the WA profile for 2023, with 51 per cent of State lithium output.9,10,20,52
- 2016 to 2023 lithium boom
It reshaped Western Australian mining and exploration.19,20,21,53
- Leo Lithium lists on the ASX
- Lithium prices peak
The two USGS figures show how price series differ between sources.21,23,53
- Wodgina lithium mine restarts
- Australia mines 92,000 t of lithium (contained)
USGS records 92,000 t of lithium content in Australian mine output in 2025.56
Across twelve chapters, the pattern repeats. A find is made, sometimes just under the soil at the base of a tree, sometimes by drill hole 23 beneath 300 m of barren rock. People and money rush in. Towns rise, prices spike, and governments step in to claim a share. Then the price falls and the weaker mines close. The metals change, from ochre to silver, gold, copper, iron, uranium and lithium. The pattern does not.36,60
Where to go next
This is the end of the main story. To go deeper, try our lessons from mining history: booms and busts, discovery to production, price shocks, social licence, resource nationalism, the deposits that made fortunes and lucky breaks. The last lesson asks whether lithium really was the new gold rush. Or go back to the beginning, with chapter 1: the first miners.20


