

How fast the news travelled
San Francisco, California: the Golden Gate bay area. Photograph, ca. 1880., Unknown (Wellcome Collection) (Public Domain Mark 1.0)
The California gold rush began with James Marshall's find at Sutter's mill on 24 January 1848. Rumours reached San Francisco in March. By the end of 1849, California held nearly 100,000 people, against about 14,000 non-Indian residents when gold was found.3,5
News of the Klondike took almost a year to spread. Gold was found on 16 August 1896, but the outside world only heard in July 1897, when the SS Portland reached Seattle with over a ton of gold. More than 100,000 people then set out, and no more than 40,000 reached Dawson City.13,14
Dawson City grew from nothing. Parks Canada estimates that 20,000 to 30,000 people lived there at the height of the rush in 1898 and 1899. By 1918 fewer than 1,000 remained.19
California gold rush
- Discovery1848-01-243Marshall at Sutter's mill
- Population before rush (1848)14,000 people (non-Indian)4State population estimate when gold was found
- Population end 1849 (1849)100,000 people4"nearly 100,000"
- Population 1852 (1852)250,000 people4"some 250,000"
- Census population (1850)92,597 people51850 US census count
- Gold recovered (1855)750,000 pounds5Estimated recovered 1848 to 1855. About 340 tonnes at 0.4536 kg per pound (computed).
- Value recovered then (1900)25,000,000,000 US dollars, modern equivalent4Mother Lode and Klamath fields together, "modern-day equivalent of more than $25 billion" by the turn of the century
- News reached san francisco1848-035Rumours reached San Francisco in March 1848
- Population after 50 years (1900)1,485,053 people5California census 1900
Victorian gold rush
- First discovery clunes1850-036Hon. W. Campbell at Clunes, "probably" first
- Rush notification1851-07-056Gold notified in the Yarra Ranges and the Pyrenees
- Commonwealth population 1851 (1851)437,665 people6Australia end of 1851
- Commonwealth population 1861 (1861)1,168,149 people6Australia end of 1861
- People who came (1861)40,000 people per year, average6"Over 40,000" a year reached Victoria 1851 to 1861
- Years as top australian producer (1898)47 years6Victoria led until Western Australia passed it in 1898
- Victoria gold 1901 (1901)730,450 fine ounces6ABS table
- Deaths at the Eureka Stockade (1854)28 people7Six police and troopers and at least 22 diggers, State Library Victoria
- Peak year18566Victoria's highest yearly gold output
Witwatersrand gold rush
- Discovery1886-078Harrison, Langlaagte; his affidavit date is not on the opened page
- Camp population (1886)3,000 people8About 3,000 inhabitants by August 1886, mostly White
- Public diggings proclaimed (1886)9 farms8Proclaimed 8 September 1886
- Towns founded (1886)1 town8Johannesburg named 3 October and declared 4 October 1886
- Transvaal gold value (1897)11,654,000 pounds sterling (assumed)6ABS table, Transvaal
- Transvaal gold value war low (1900)1,481,000 pounds sterling (assumed)6Output collapsed during the South African War
- Transvaal gold value later (1909)30,988,000 pounds sterling (assumed)6ABS table, Transvaal
- Transvaal share of world gold (1909)33.7 percent6Computed: 30.988 / 91.91
Hannan finds gold at Kalgoorlie
- Coolgardie find (1892)554 ounces9Bayley, September 1892
- Bayleys reward output (1962)500,000 ounces over about 70 years9"over 500,000 ounces"
- Goongarrie alluvial1893-056ABS Year Book
- Kalgoorlie discovery1893-0610Hannan and Flanagan
- Wa gold output (1901)1,703,417 fine ounces6ABS table
- Wa gold output peak (1903)2,064,803 fine ounces6Peak for WA and for Australia
- Wa share of australian gold53.15 percent, 1901 to 1909 annual average6ABS table
- Water pipeline length (1903)566 kilometres11Goldfields Water Supply Scheme, built 1898 to 1903
- Water pipeline cost then2,500,000 pounds (debate figure of 1898)12"two and a half million pounds" quoted in the Assembly debate, WA Museum
Klondike gold rush
- Discovery1896-08-1613Parks Canada; staking on 17 August per its history text
- News to outside world1897-0714SS Portland reached Seattle with over a ton of gold
- People who set out (1900)100,000 people14Set out for the Klondike 1897 to 1900 ("more than")
- People who came (1900)40,000 people14"No more than 40,000" reached Dawson City
- Canada gold value before (1897)1,240,000 pounds sterling (assumed)6Canada national gold yield, ABS table; Klondike share not separated
- Canada gold value peak (1900)5,742,000 pounds sterling (assumed)6Canada national gold yield, ABS table
- World gold value (1900)52,086,000 pounds sterling (assumed)6World gold yield 1900, ABS table
- Canada share of world gold (1900)11 percent6Computed from the two ABS values (5.742 / 52.086)
2016 to 2023 lithium boom
- Price start (2016)8,650 US dollars per tonne, lithium carbonate annual average1USGS MCS 2020 (US large-contract price)
- Price 2017 (2017)15,000 US dollars per tonne, lithium carbonate annual average1USGS MCS 2020
- Price trough (2020)8,600 US dollars per tonne, lithium carbonate annual average15USGS MCS 2024 series
- Price peak (2022)68,100 US dollars per tonne, lithium carbonate annual average15USGS MCS 2024. The MCS 2023 edition gave 37,000 for 2022 with a different price source.
- Price end (2023)46,000 US dollars per tonne, lithium carbonate annual average15USGS MCS 2024. WATC gives US$45,363 from S&P/Benchmark data.
- Spodumene spot 2021 (2021)450 to 2300 US dollars per tonne (6% Li2O, c.i.f. China), January to November16USGS MCS 2022
- Spodumene spot 2022 (2022)4900 to 5800 US dollars per tonne (6% Li2O, c.i.f. China), January to November17USGS MCS 2023
- Spodumene spot 2023 (2023)6000 to 2500 US dollars per tonne (6% Li2O, Australia f.o.b.), January to November15USGS MCS 2024
- Wa lithium sales before (2022)8 billion Australian dollars2Financial year 2021-22
- Wa lithium sales peak (2023)20.9 billion Australian dollars2Financial year 2022-23
- Wa lithium exports (2023)18.4 billion Australian dollars (up 52 per cent)2Calendar year 2023
- World lithium supply (2023)180,000 tonnes of lithium content (from 35,000 in 2013)2WATC; USGS gives 146,000 for 2022 and about 180,000 for 2023
- Australia mine production86,000 tonnes of lithium content (2023 estimate; 58,800 in 2018)15USGS MCS 2024 and MCS 2020
- Australia mineral operations among majority of output4 to 6 operations, varying by year (6 in 2019, 5 in 2020, 4 in 2021, 6 in 2022)17Count of Australian mineral operations USGS names as making up most world output; it is not a count of new mines. Opening dates for new mines were not sourced.
- Capital raised example (2022)100,041,906 Australian dollars before costs (Leo Lithium IPO)18One company only. No ASX or government sector total was found; left as a gap.
- Mine restart (2022)Wodgina trains 1 and 2 restart after care and maintenance2
The lithium boom had no single day of discovery. It shows up instead in prices. USGS put the US average lithium carbonate price at 8,650 dollars a tonne in 2016 and 15,000 dollars in 2017. The peak came in 2022 at 68,100 dollars. The news travelled instantly, but the boom still took six years to peak.1,15
The gold rushes moved people on a vast scale. California's population reached some 250,000 by 1852. Fifty years after the find, the 1900 census counted 1,485,053 people.4,5
14,000 to 250,000 people
California's population, from the gold find of 1848 to 18524
In Australia, over 40,000 people a year reached Victoria between 1851 and 1861. The population of the whole continent rose from 437,665 at the end of 1851 to 1,168,149 ten years later.6
Victoria's fields held their people for longer. Gold was found at Ballarat in July and August 1851, and the field gave about 9.3 million ounces by 1870. About 50,000 people still lived there in 1871. Bendigo, found in October 1851, gave about 400,000 ounces a year through the 1850s, with a peak of 447,212 ounces in 1858. Around 1900 it still gave about 200,000 ounces a year.22,23
Western Australia's rush was smaller but intense. Within about a week of Hannan's find at Kalgoorlie in June 1893, more than 1,400 men were working the field. Coolgardie, nearby, had about 25,000 people by 1897.20,24
The lithium boom moved money rather than crowds. Western Australia's lithium sales rose from 8.0 billion Australian dollars in 2021-22 to 20.9 billion in 2022-23. One company, Leo Lithium, raised just over 100 million Australian dollars in a single share sale in June 2022.2,18

Who could take part
The hot desert coast of Western Australia's Pilbara region, NASA JSC (Public domain (NASA media, no copyright))
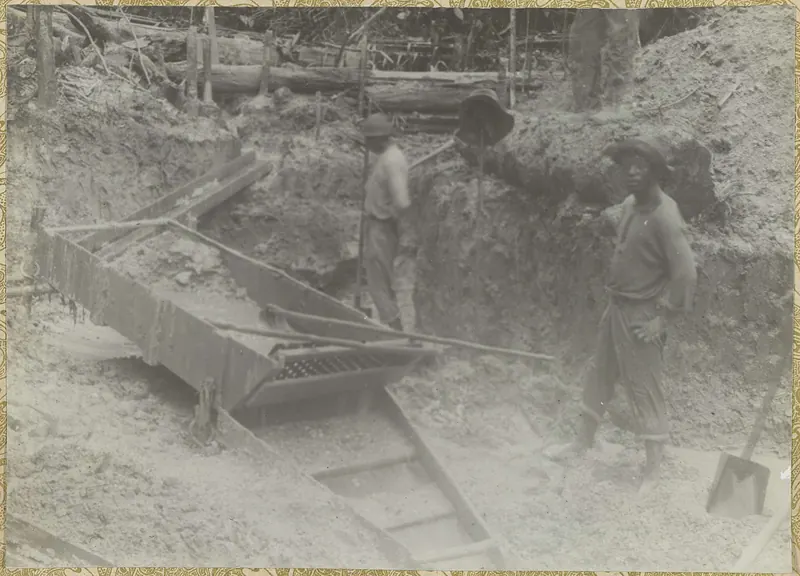
In the early gold rushes, almost anyone could join. Alluvial gold could be won with a pan. The Welcome Stranger, the largest nugget ever found, was found just under the soil at the base of a tree.6,26
Lithium cannot be panned. Hard-rock lithium comes from pegmatites that must be blasted, crushed and concentrated. Greenbushes had produced 37.1 Mt of concentrate by mid-2025. Pilgangoora produced 224.8 kt in a single quarter of 2025.25,27
The lithium rush often went back to old mining ground. Edward Hardman reported tin at Greenbushes in 1886, and David Stinton found a tin field there in 1888, which brought alluvial miners. Exploration in the 1970s found a pegmatite 5 km long with tin, tantalum and spodumene. Lithium production began in 1983, more than thirty years before the boom. In 2023 Greenbushes gave 51 per cent of the state's lithium output.2,28,29
Brine has a long history too. The first lithium from brine came in 1938, as a by-product at Searles Lake in California. Clayton Valley in Nevada followed in 1966. Albemarle still runs it as Silver Peak, the only commercial lithium brine operation in the United States.30,31
Brine lithium needs pumps, ponds and chemical plants. SQM's Chilean lithium carbonate capacity reached 180,000 t a year after expansions in 2022.32,33
So the lithium rush was a rush of companies and investors, not of individual diggers. The number of Australian operations that made most of the world's output was four to six in the years from 2019 to 2022.2

How big, and for how long
Salar de Atacama, Chile, NASA/METI/AIST/Japan Space Systems, and U.S./Japan ASTER Science Team (Public domain (NASA media, no copyright))
California produced an estimated 750,000 pounds of gold from 1848 to 1855, about 340 t.5
Victoria led Australian gold production for 47 years, until Western Australia passed it in 1898. Its highest output came in 1856, five years after the rush began. Western Australia's output peaked at 2,064,803 fine ounces in 1903, ten years after Kalgoorlie.6
Australia gold production, 1851 to 1910
Australia gold production rose from 9.94 tonnes in 1851 to 84.62 tonnes in 1910; the peak in this series is 119 tonnes in 1903. Basis: contained gold in dore, concentrate or bullion leaving the mine.
Sources: A Comprehensive Dataset for Australian Mine Production, 1799 to 2021 (v1.4b, Tab04…; U.S. Geological Survey Mineral Commodity Summaries 2024 Data Release - world.zip…; U.S. Geological Survey Mineral Commodity Summaries 2025 Data Release (ver. 2.0, April…; Mineral Commodity Summaries 2026 Data Release - MCS2026_Commodities_Data.csv (world…
Lithium grew faster. World lithium supply rose from about 35,000 t of lithium content in 2013 to about 180,000 t in 2023. Australia's mine output rose from 58,800 t in 2018 to an estimated 86,000 t in 2023.2,15
Australia lithium production, 1985 to 2021
Australia lithium production rose from 721 tonnes in 1985 to 55,000 tonnes in 2021; the peak in this series is 58,800 tonnes in 2018. Basis: contained lithium in spodumene concentrate (t Li).
Sources: A Comprehensive Dataset for Australian Mine Production, 1799 to 2021 (v1.4b, Tab04…; U.S. Geological Survey Mineral Commodity Summaries 2024 Data Release - world.zip…; U.S. Geological Survey Mineral Commodity Summaries 2025 Data Release (ver. 2.0, April…; Mineral Commodity Summaries 2026 Data Release - MCS2026_Commodities_Data.csv (world…
The Witwatersrand shows how a rush can become a permanent industry. The Transvaal's gold yield was valued at 11.65 million pounds in 1897 and 30.99 million in 1909, about a third of the world's gold.6

The bust, and what was left
Clayton Valley, NV, NASA/METI/AIST/Japan Space Systems, and U.S./Japan ASTER Science Team (Public domain (NASA media, no copyright))
The lithium bust came quickly. The average lithium carbonate price fell to 46,000 dollars in 2023. Western Australia's lithium royalty receipts fell by 64.89 per cent in 2024-25. Mt Cattlin was placed on care and maintenance by the end of March 2025.15,38,39
The gold rush busts were slower but deeper for the towns. Coolgardie's 25,000 people of 1897 had become 773 by 2021.20,21
The gold rushes also left lasting works. To supply water to the Western Australian goldfields, the state built a 566 km pipeline between 1898 and 1903. In the Assembly debate of 1898 its cost was put at two and a half million pounds.11,12
They left political marks too. Ballarat miners opposed the gold licence system, which made every digger pay for the right to dig. On 30 November 1854 about 500 of them gathered under the Eureka flag and elected Peter Lalor as their leader. On 3 December police and troops attacked the stockade. Six police and troopers and at least 22 diggers died, and 125 miners were taken prisoner. The dispute over licence fees and policing is still a landmark of the Victorian goldfields. The lithium boom produced no event like it.7
Some projects kept going through the bust. In Nevada, Lithium Americas targets mechanical completion of the first phase at Thacker Pass in late 2027. It is backed by a 2.26 billion dollar loan from the US Department of Energy.40
What the lithium boom will leave is not yet clear. It has left mines that restarted, like Wodgina in 2022, and others put on hold.2

Where the metal went
A lithium extraction facility in Bolivia's Salar de Uyuni, NASA JSC (Public domain (NASA media, no copyright))
In 1900 the world's gold yield was valued at 52.1 million pounds.6
Lithium went almost entirely to one country for processing. China took 99 per cent of Western Australia's lithium exports by value in 2023. Australia exported 2.7 Mt of spodumene ores and concentrates in 2022.67,68
Batteries now take about 88 per cent of lithium use. Our guide to the battery shows where it ends up.37
So, is lithium the new gold rush?
In some ways, yes. Both brought a sudden flood of interest, high prices, new companies and new towns, followed by a fall. In other ways, no. The gold rushes moved hundreds of thousands of people who could dig for themselves. The lithium boom moved capital, ran through a small number of large operations, and sold mainly to one buyer. The records suggest the comparison works best for the money, and least well for the people. For the full story of both, read chapter 5, the gold rushes, and chapter 12, the new rush, and our story gold rush, then and now.2,5
- James Marshall finds gold at Sutter's sawmill1848
- Victorian gold rush1851
- Gold found on the Witwatersrand1886
- Hannan finds gold at Kalgoorlie1893
- Gold found on Rabbit (Bonanza) Creek1896
- 2016 to 2023 lithium boom2016
- Greenbushes1888
- Ballarat goldfield1851
- Bendigo goldfield1851
- Thacker Pass
- Pilgangoora
- Wodgina
- Salar de Atacama (SQM / Nova Andino Litio)
- Silver Peak1966
- California Gold Rush begins
California Gold Rush begins.41
- Victoria produces most of the worlds gold
Gold escorts carried about a tonne a week from Mount Alexander to Melbourne at the peak.42,43
- Fraser River gold rush
The rush led Britain to create the Colony of British Columbia in 1858, partly from fear of American annexation. The legislature dates this to 2 August and Parks Canada to 19 November (proclamation by Governor James Douglas).44,45,46
- Otago gold rush
It financed the early growth of Dunedin and the colony.47,48
- Alluvial gold found at Pilgrim's Rest
- Mount Morgan gold mining begins
The site is now a major abandoned mine remediation project.51,52
- Cyanide process for gold developed in Scotland
USGS says heap leaching with cyanide was proposed in 1969 as a way to treat low-grade ores.53,54,55
- Jameson Raid
Jameson Raid.56
- Steamship Portland docks at Seattle with a ton of Klondike gold
The ship carried 68 miners from St. Michael, and news of the gold set off the stampede.57,58,59
- Harry Oppenheimer born
Harry Oppenheimer born (date from Wikidata).60
- Bretton Woods conference
Bretton Woods conference.61
- Grasberg mine area: Wikidata inception date
The Papua copper-gold mine is dated to 1972 in Wikidata.62
- Summitville mine environmental crisis
- BHP leaves Ok Tedi after river damage claims
It links a miner's exit from a mine to claims over river damage.65,66


