

Gold at 35 dollars: when the price is set by law
Kalgoorlie-Boulder, Australia, NASA/JPL-Caltech (Public domain (NASA media, no copyright))
For long stretches of history, the price of gold was fixed by governments. In 1900 the United States set it at 20.67 dollars an ounce. On 30 January 1934 President Roosevelt signed the Gold Reserve Act. Gold was handed in at 35 dollars an ounce, a rise of about 70 per cent.1
Mines answered. USGS records world gold output of 648 t in 1930. See our gold page for the metal today. By 1940 it was 1,310 t, roughly double.4
648 to 1,310 t
World gold output in 1930 and in 1940, after the 1934 price rise (USGS)4
The higher price could revive old fields. At Wiluna in Western Australia, the town grew to over 9,000 people in the mid-1930s as the Depression raised gold prices.5
Holding a fixed price got harder over time. In 1961 eight central banks formed the London Gold Pool to keep gold at 35 dollars. After a run on gold, the pool collapsed in March 1968. On 15 August 1971 President Nixon closed the gold window, and gold lost its fixed dollar price.2,6
Output did not jump at once. USGS records 1,480 t in 1970, 1,200 t in 1975 and 1,220 t in 1980. It then climbed to 2,180 t in 1990 and 2,590 t in 2000. Nevada's Carlin Trend, where the Gold Quarry and Rain deposits were found in 1980, was among the new sources. The chart shows the whole century.4,7
World gold production, 1925 to 2020
World gold production rose from 591 tonnes in 1925 to 3,050 tonnes in 2020; the peak in this series is 3,310 tonnes in 2018. Basis: fine gold, world mine output.
Sources: Annual Report of the Director of the Mint for the fiscal year ended June 30, 1915…; Annual Report of the Director of the Mint for the fiscal year ended June 30, 1915…; Historical Statistics for Mineral and Material Commodities in the United States (Data…
Silver: a law and a squeeze
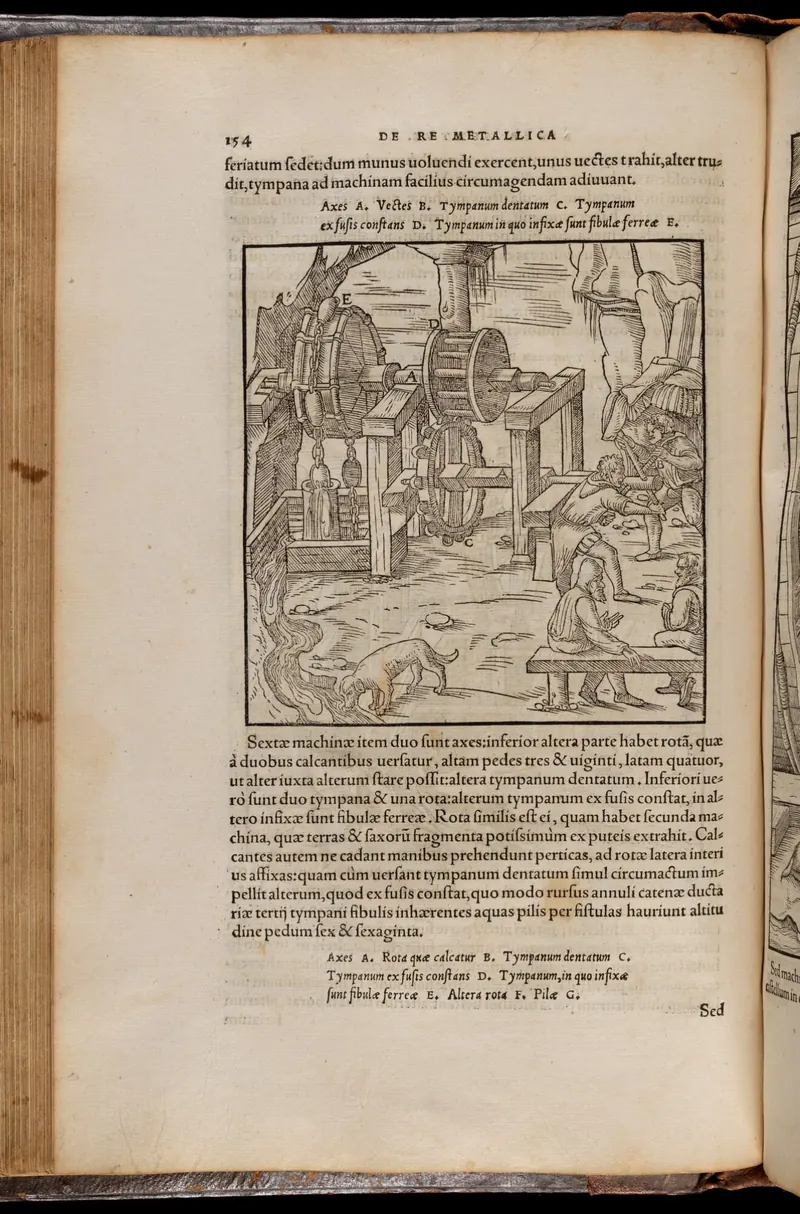
Folio 154. Medieval mining techniques. Woodcut, 1556, Unknown (Wellcome Collection) (Public Domain Mark 1.0)
A price can fall as fast as it rises. In Colorado, Horace Tabor's silver fortune shrank when the move to the gold standard cut the value of silver. His fortune was lost after 1893, and he died nearly penniless in 1899.8
Nearly a century later, silver had another shock. In early 1980, after a squeeze on the silver market, prices plummeted. On 28 March 1980 the Commodity Futures Trading Commission voted not to use its emergency powers to suspend silver futures trading. Tighter limits on the size of positions followed, and the commission reported to Congress in 1981.9
Mine output barely noticed the crash in price. USGS records world silver production of 10,700 t in 1980, 13,100 t in 1985 and 16,600 t in 1990. The long rise in output carried on.10

Tin, 1985: when a price support breaks
Pangkalpinang. Mijn 3b. Een reeks koelies bezig met het transporteeren van grond, Europeana (Public Domain Mark 1.0)
The most sudden shock in this history came in tin. For decades an International Tin Agreement between producing and consuming countries supported the price. On 24 October 1985 its council ran out of money, having borrowed over 900 million pounds. The London Metal Exchange suspended tin trading, and the price fell to about half its previous level.11,12
900m pounds
Borrowed by the International Tin Council before its collapse in 198511
Output had already turned before the crash. USGS records world tin production of 245,000 t in 1980 and 181,000 t in 1985. It was 221,000 t in 1990. Our tin page covers where tin is mined now.14
The collapse reached mining towns. In Bolivia, economic policy in 1985 cut 23,000 mining jobs. In Cornwall, South Crofty, the last working tin mine, kept going until 1998 and then closed.13,15
Cobalt, 1978: a supply scare
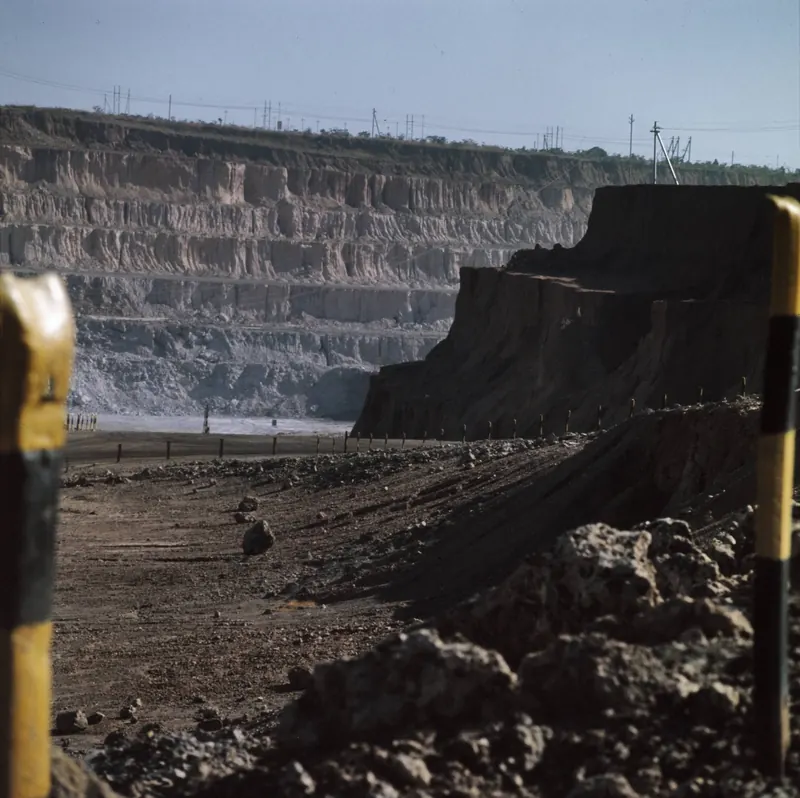
Zaire (voorheen Belgisch Congo ); kopermijn de Kolwezi, Mieremet, Rob / Anefo / Europeana (Public Domain Mark 1.0)
Some shocks come from the supply side. Insurgents invaded Shaba, now Katanga, in 1977 and 1978 and occupied Kolwezi. USGS says this led to a panic in the cobalt market. The USGS director later wrote that cobalt prices rose precipitously.16,17
World cobalt output was 20,800 t in 1977 and 31,300 t in 1980. By 1985 it was 47,400 t. Then it fell back, to 24,500 t by 1995.18
World cobalt production, 1960 to 2005
World cobalt production rose from 14,200 tonnes in 1960 to 65,200 tonnes in 2005; the peak in this series is 65,200 tonnes in 2005. Basis: cobalt content.
Sources: Historical Statistics for Mineral and Material Commodities in the United States (Data…
USGS says the shock made Western governments worry about cobalt from central Africa, and that it still shapes the debate on critical minerals.16

Rare earths, 2010: a quota and a rush to build
Mountain Pass Mine, California, NASA/GSFC/METI/ERSDAC/JAROS, and U.S./Japan ASTER Science Team (Public domain (NASA media, no copyright))
By 2010 China produced over 90 per cent of the world's rare earths, after Mountain Pass in California stopped mining from 2002 to 2011.20
In July 2010 China cut the second part of its export quota to 7,976 t, against 26,427 t a year earlier. USGS says the full 2010 quota was 37.1 per cent below 2009, and actual exports fell 40 per cent. Rare earth prices rose sharply.19
New supply followed within two years. Lynas began producing concentrate at Mount Weld in Western Australia in 2011. Molycorp commissioned new operations at Mountain Pass in 2012, planned at 19,000 t a year of rare earth oxides.20
Then prices fell. Molycorp idled Mountain Pass in 2015. MP Materials bought the site in July 2017, and in 2025 it produced 50,692 t of rare earth oxide in concentrate.20,21
World output records the whole cycle: 122,000 t in 2005, 101,000 t in 2010, 129,000 t in 2015 and 243,000 t in 2020. Even after the new mines, USGS estimates China mined 270,000 t of the world's 390,000 t in 2025. See our rare earths page.22,23
Gluts: when supply outruns demand
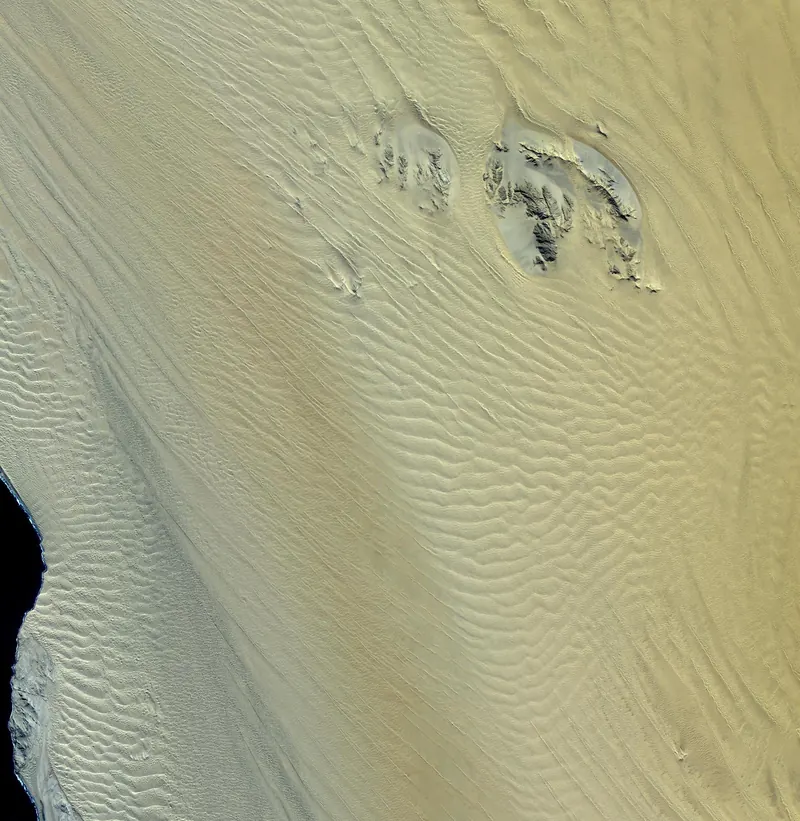
Namib Desert, Namibia, NASA/GSFC/METI/ERSDAC/JAROS, and U.S./Japan ASTER Science Team (Public domain (NASA media, no copyright))
A price shock can also run downwards for years. In 1937 Union Minière stopped work at the Shinkolobwe uranium mine in the Congo. Its stocks of radium and uranium were enough to cover the next 30 years of demand. Within five years, the war had made the same ore the most sought after in the world, as told in chapter 9.26
Australia's first uranium boom shows the same swing. Output rose from 13.9 t of uranium oxide in 1954 to 1,338 t in 1961, then fell to 230 t in 1970.24
In Namibia, the Langer Heinrich uranium mine went on care and maintenance in 2018. Its owner released a plan to restart it in November 2021.27,28
Low prices close mines in every metal. Glencore's Mutanda mine in the Congo produced 103,200 t of copper in 2019, then went on care and maintenance at the end of that year because of low cobalt prices.29
Nickel shows how a surge of supply in one country can reshape another. Indonesia's nickel output rose from 771,000 t in 2020 to an estimated 2,600,000 t in 2025. Over the same years Australia's output, which had peaked at 230,767 t in 2012, fell to an estimated 45,000 t, and BHP moved its Nickel West business to temporary suspension in 2024.23,24,25,30
- Gold Reserve Act signed1934
- Silver price collapse after the Hunt silver squeeze1980
- International Tin Council collapse1985
- Shaba invasions trigger a cobalt market panic1978
- China cuts rare earth export quota2010
- 2016 to 2023 lithium boom2016
- Shinkolobwe
- Mountain Pass1952
- Mount Weld
- Mutanda
- Wodgina
- Langer Heinrich

Lithium, 2016 to 2023, and what the cases share
Clayton Valley, NV, NASA/METI/AIST/Japan Space Systems, and U.S./Japan ASTER Science Team (Public domain (NASA media, no copyright))
The lithium price rose from 8,600 dollars a tonne in 2020 to 68,100 dollars in 2022, by USGS figures, and fell to 46,000 dollars in 2023. Mines restarted, like Wodgina in 2022, and new ones opened in Mali in 2024. By 2025 others, like Mt Cattlin, were back on care and maintenance. Our last lesson sets this boom beside the great gold rushes.32,52
The same pattern ran through platinum in the 1920s. Hans Merensky's find of 1924 set off a rush, and falling prices closed all but two of his mines by 1930.54
Across these cases, a few things recur. Supply takes years to respond to a higher price, and then often arrives as the price is falling. Price supports and quotas can hold for a time, but the tin and gold cases show they can break suddenly. And a shock in one metal can end careers and towns, as in Leadville, Bolivia and Cornwall, long before the records show it. None of this predicts the next shock. It describes the ones that have already happened.
- LKAB founded
LKAB built the iron mines and the model town of Kiruna.33,34
- Port Hedland gazetted as a town
Port Hedland was gazetted in 1896.35
- Second Boer War begins
Second Boer War begins.36
- Katanga copper production begins
Oxide ore near the surface was mined by hand and at first shipped to Belgium for processing.37,38
- Anglo American founded
Anglo American founded.39
- Yellowknife: inception recorded
Yellowknife has an inception date of 1936 in Wikidata.40
- Vale founded
Vale founded.41
- Asbestos mining at Wittenoom ends
The legacy is disease: the WA government says the remnants have already caused thousands of deaths among miners, residents and visitors.42,43,44
- Mt Newman project is officially opened
Governor-General Sir Paul Hasluck opened the project that railed Mount Whaleback ore to Port Hedland.45,46
- Benguela Railway closes to Zairian traffic
Political differences between Zaire and Angola shut the shortest route for Shaba exports.47,48
- International Tin Council collapse
It ended a long-running producer and consumer agreement.11,12,49
- Mountain Pass mining stops
The pause left China with over 90 percent of world rare earth production in the years that followed.20,50
- Angola awards a 30-year Benguela Railway concession
The Lobito Atlantic Railway consortium took over the Angolan line (some sources date the award to 2023).48,51
- Wodgina lithium mine restarts
Next in this series: social licence, disasters and the cost of losing trust.16


