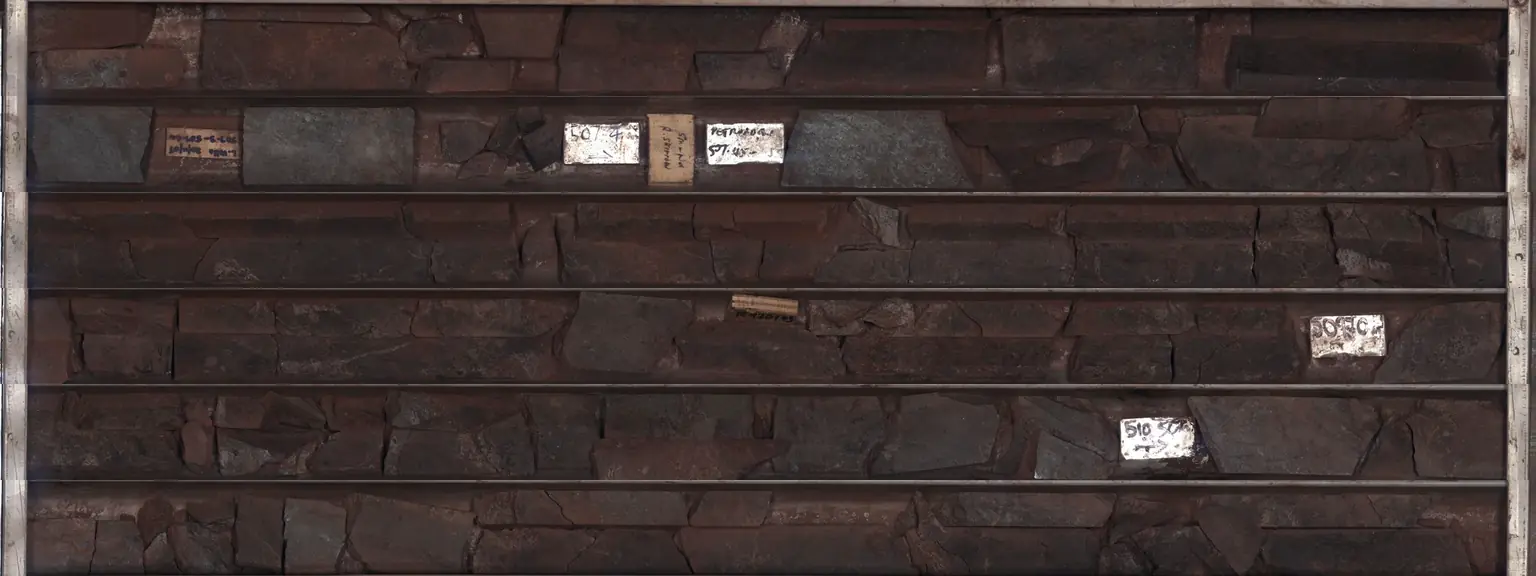
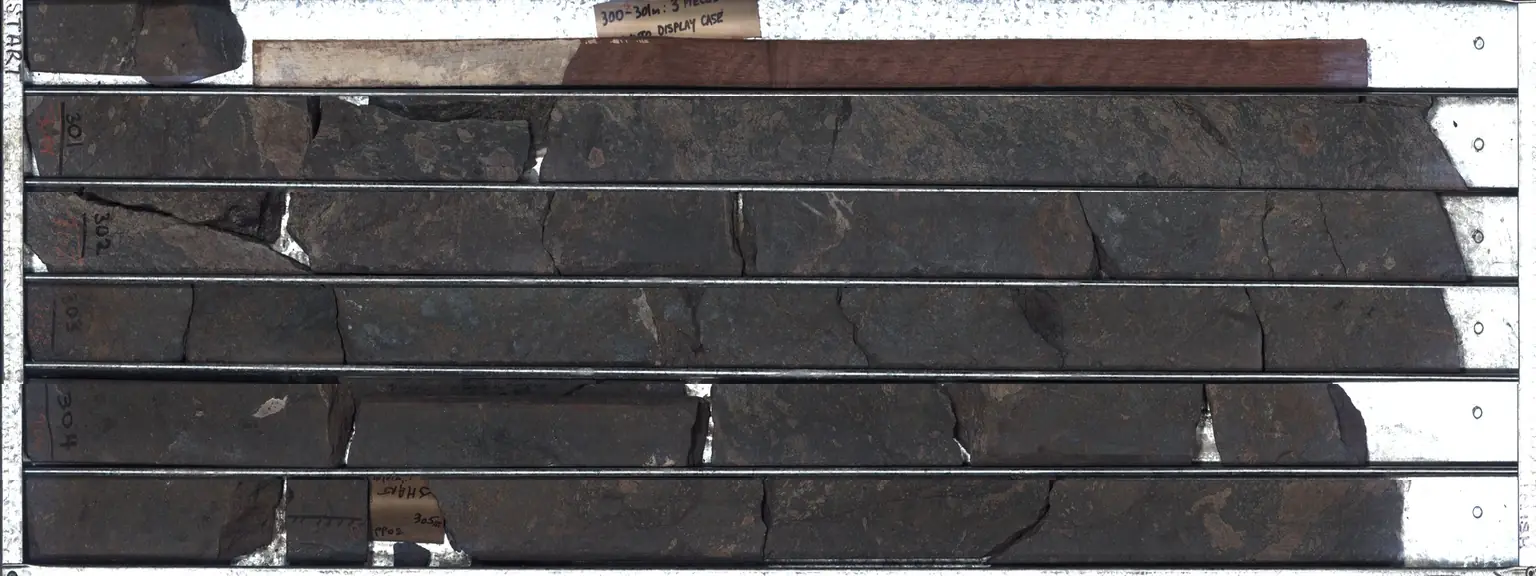
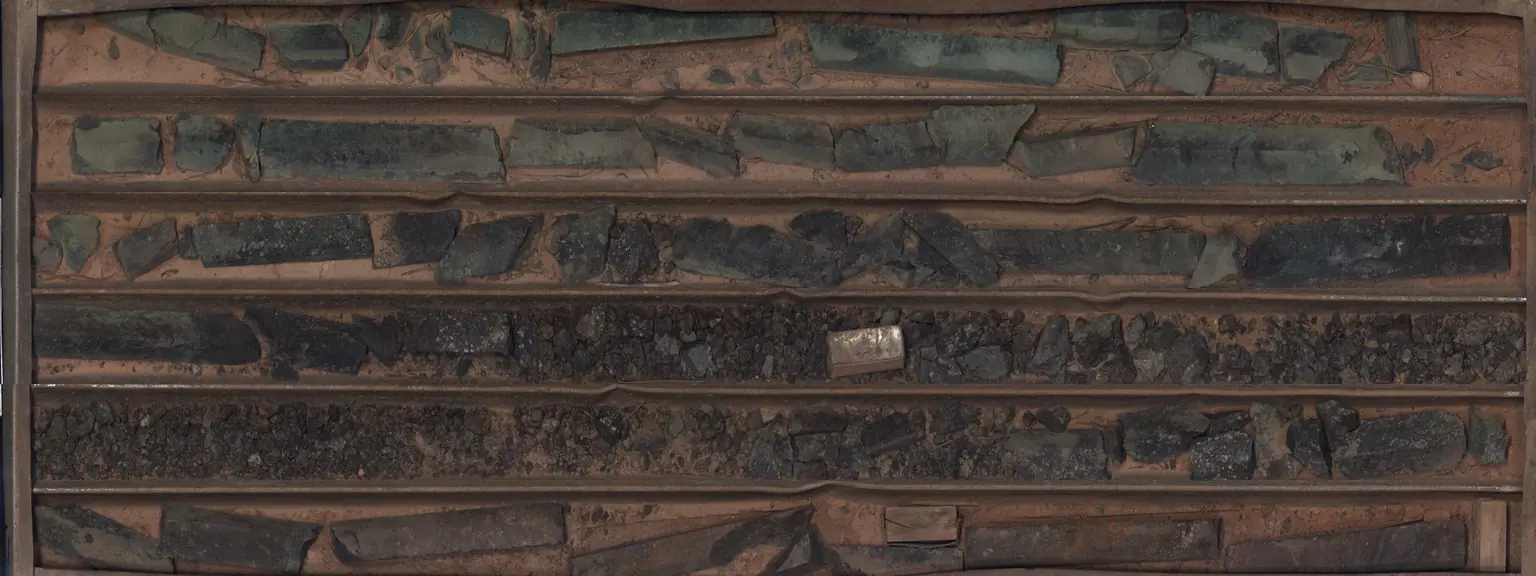
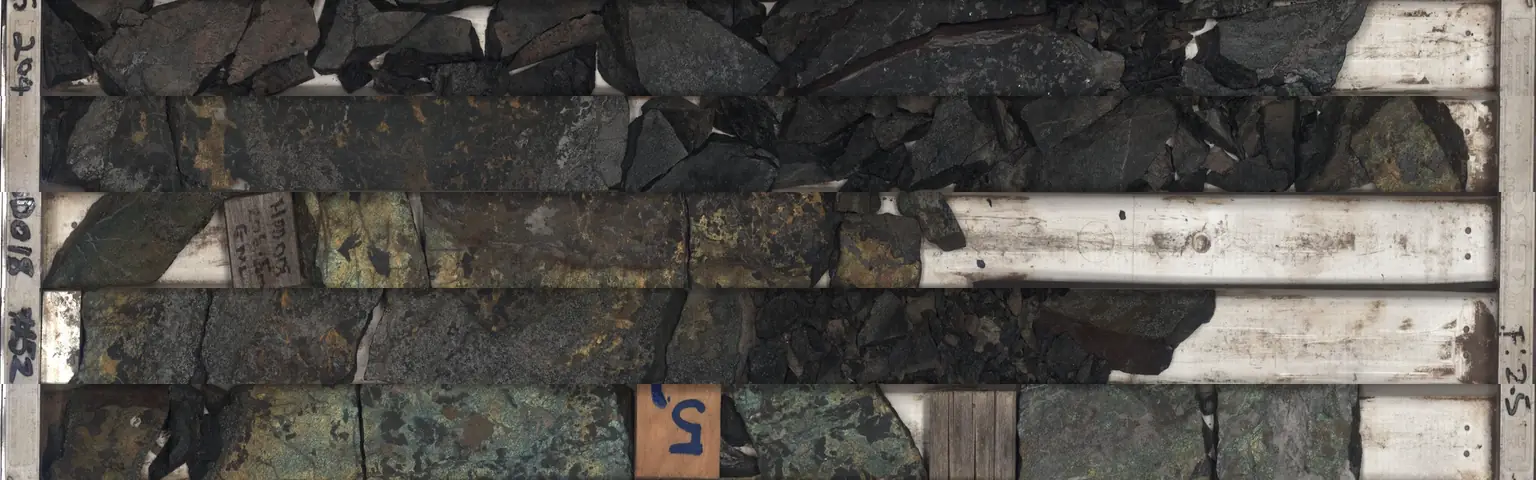
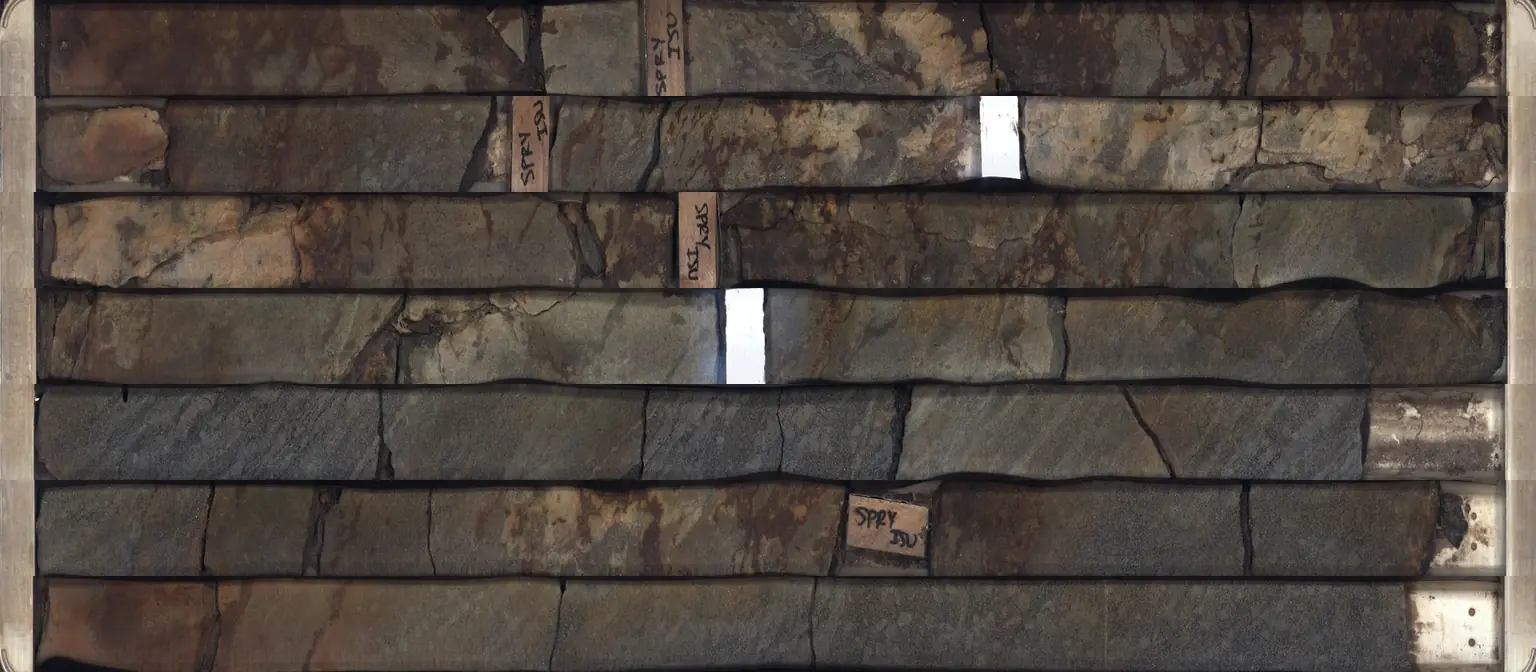
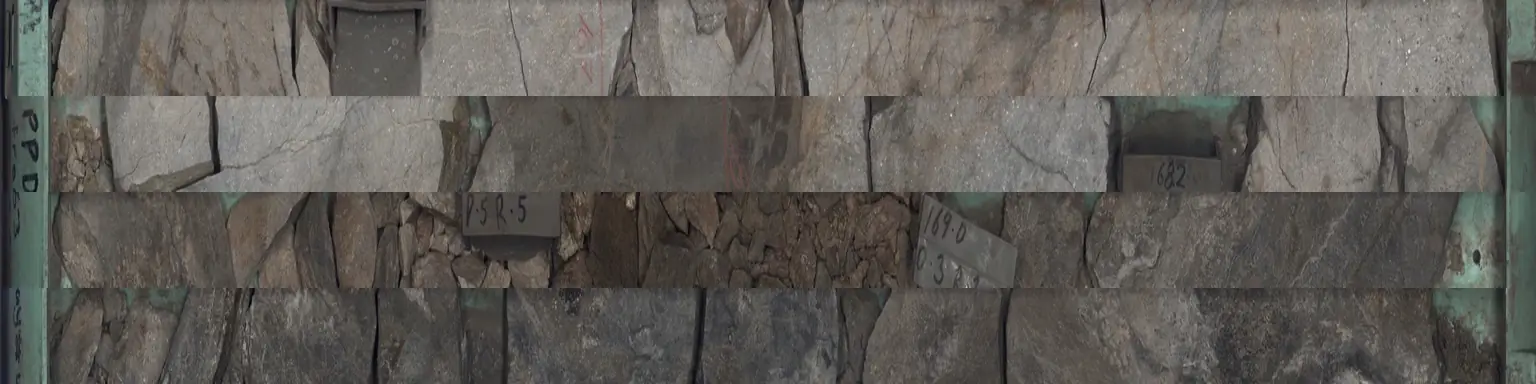
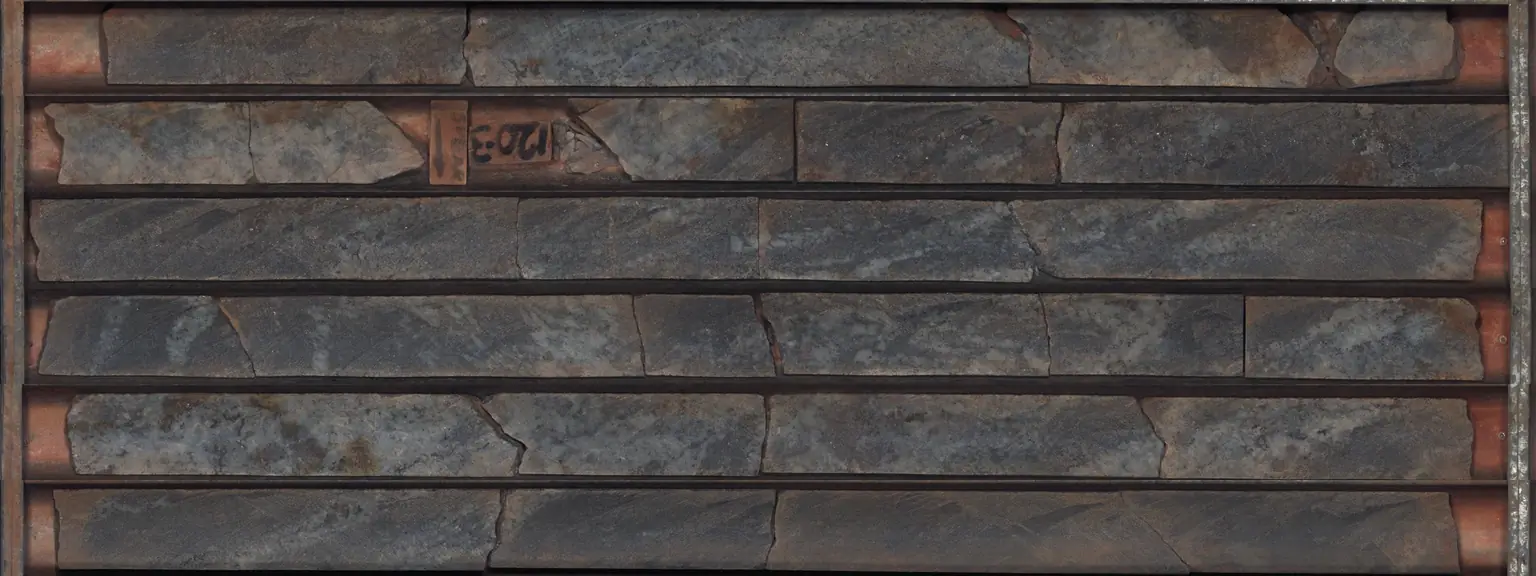
563 trays of real drill core from seven South Australian discoveries and mines, scanned metre by metre at the state's core
library. Pull a tray, light up the assays along the core and learn to log it.
Every diamond drill hole comes out of the ground as a column of rock about the width of a broom handle, laid in trays a metre long in the
order it was cut. Mining companies and governments keep those trays in core sheds and core libraries for decades, because the core is the
only direct sample of what lies underground. South Australia's Drill Core
Reference Library at Tonsley holds core from over 130 years of exploration, and its HyLogger scans trays with visible and infrared light,
photographing every centimetre and reading the minerals from their spectra. The scans are shared through AuScope's
National Virtual Core Library.
This shed holds 7 of those holes: 2,886 metres of scanned core in 563 trays, with 1,889 assays from the government's open
SARIG database lined up against the photographs. In the 3D view each rack is one hole and each tray end glows by the best assay inside it. Pull a
tray onto the bench to see the core up close, switch between the photograph, the assays and the minerals, follow the strip log of the whole hole,
and walk through how a geologist logs core and turns assays into the interval you read in a company release. It pairs with our guide
What is drill core? and with how to read drill results.
Copper-uranium-gold (IOCG) · drilled by BHP Billiton OD Corp. Pty Ltd. in 1980 · 697 m deep · 68 trays scanned from 306 to 697 m · 258 assayed samples
Tray 17, 399.5 to 405.2 m, best sample 6.40% Cu at 404.0 to 405.0 m. Open it on the bench to see each sample lit along the core.
At a 0.2% cut-off the open assays join into 34 m at 1.99% from 375.0 m (our arithmetic, see below).
Western Mining Corporation discovered Olympic Dam in 1975, when hole RD1 cut 38 m at 1.05% copper; RD33 is a 1980 hole from the drilling that followed. Source
Hole RD10 cored 170 m at 2.12% copper, and by November 1976 the discovery was judged economic. Source
The photographs are the HyLogger's own scans, one row of a tray at a time. The library records the depth of every scan sample, so each point
across a photograph has a depth, and the assays and minerals are placed on the core by that depth. Assays are the open SARIG laboratory results
for each hole, shown as % for copper, lead, zinc and iron, g/t for gold and silver and ppm for uranium. The minerals are the HyLogger's automated
interpretation (TSA) of the shortwave and thermal infrared spectra in half-metre steps; dark, iron-rich or very fine rock often scans as
"aspectral" and is left uncoloured.
The intervals are our own arithmetic, not the companies' published figures: we join touching samples at or above the cut-off, allow up to 2 m
of lower-grade samples inside an interval while its average stays above the cut-off, and report the length-weighted average. Companies choose their
own rules and often report different widths, so a figure here can differ from the one in the original release. The holes were drilled by the
companies named, at the time named; several of the deposits have changed hands since. Nothing here rates a company or a project, and it is not
investment advice.
Sources and credits
Core photographs and HyLogger mineralogy: Geological Survey of South Australia, Department for Energy and Mining, South Australia Drill Core Reference Library, via AuScope's National Virtual Core Library, CC BY 3.0. NVCL data services ·
collection record · licence
Assays and collars: The Department for Energy and Mining, the Government of South Australia, SARIG data package, sourced 24 October 2026, CC BY 4.0. Rows cropped and resized, assays filtered and converted to display units by Prospector Trails; not endorsed by the Government of South Australia. SARIG data package ·
licence