
Escondida, the world's biggest copper mine, 1986 to 2025
In 1986 the Quebrada Escondida, south-east of Antofagasta, was empty desert with a few exploration tracks. The ore lay under 300 m of barren cover and nobody had seen it until a drill hole in 1981. Slide through forty years and watch two pits, the leach pads and the concentrators spread across the Atacama.
Forty years, frame by frame
One clear picture every five years, all on one grid, 24 km across. Pick a frame to open the viewer on it, drag the timeline, or press Play. Compare puts any two years side by side under a divider you drag.
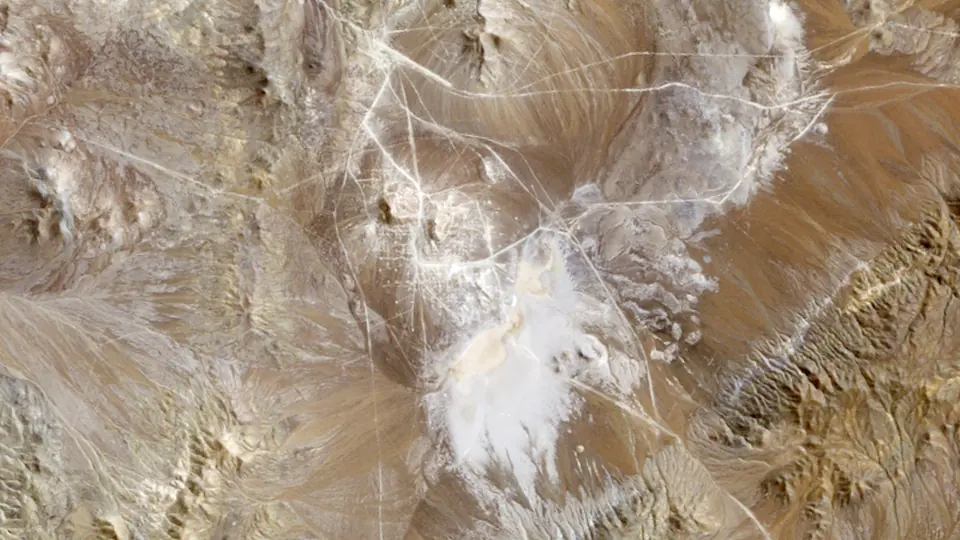 1985 · 2 Apr 1986
Landsat 5
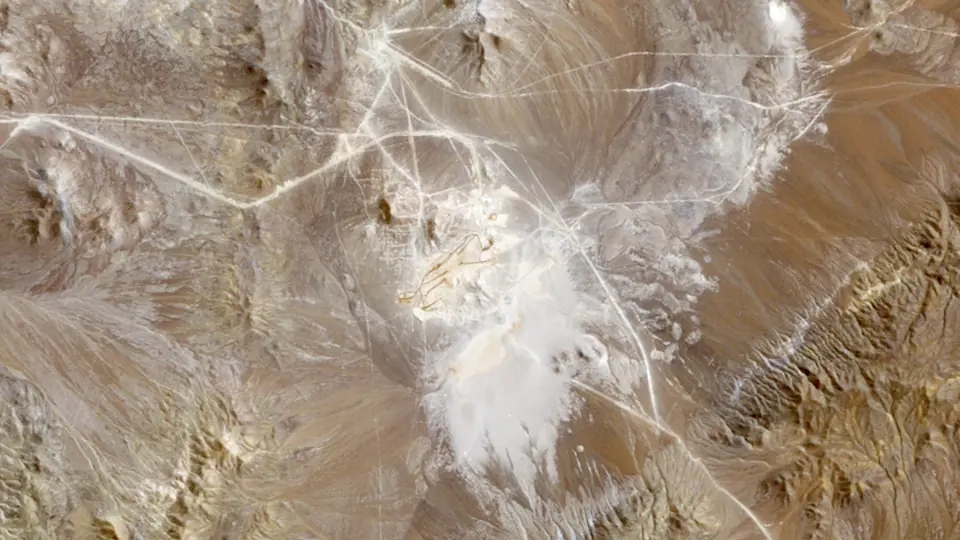 1990 · 25 Mar 1989
Landsat 5
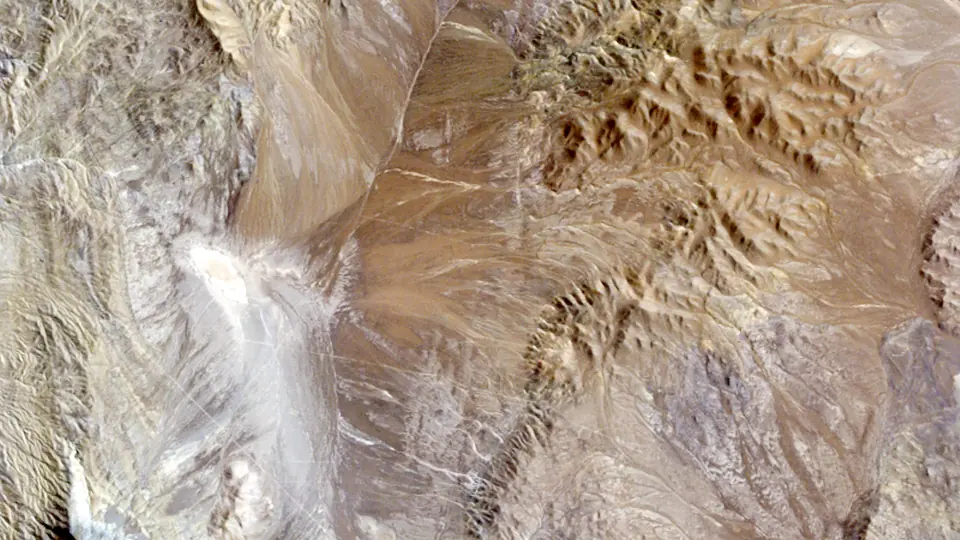 1995 · 12 Mar 1996
Landsat 5
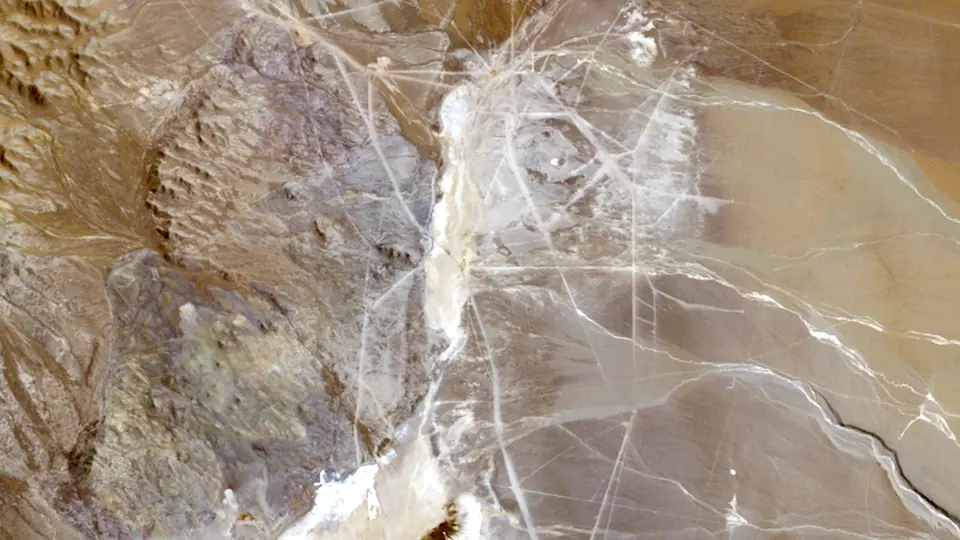 2000 · 26 Mar 2001
Landsat 5
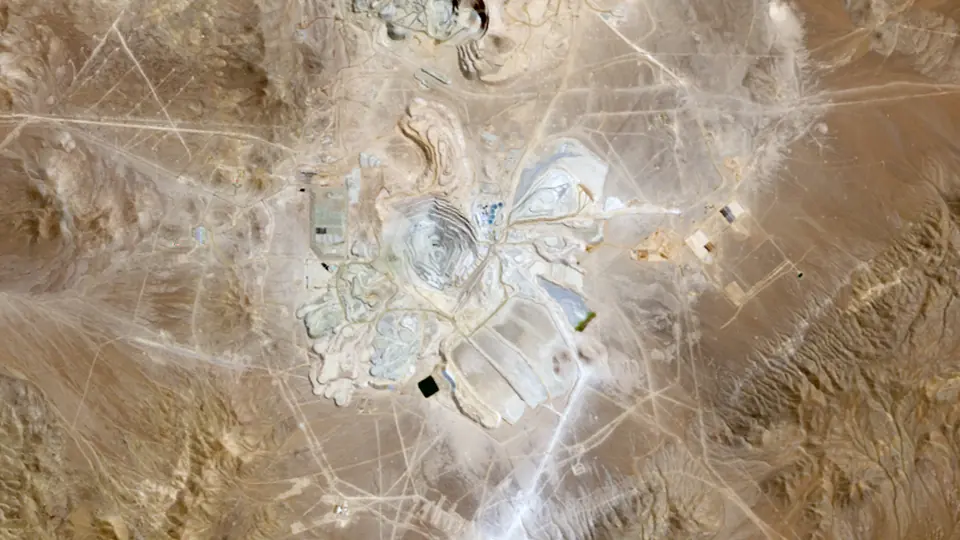 2005 · 21 Mar 2005
Landsat 5
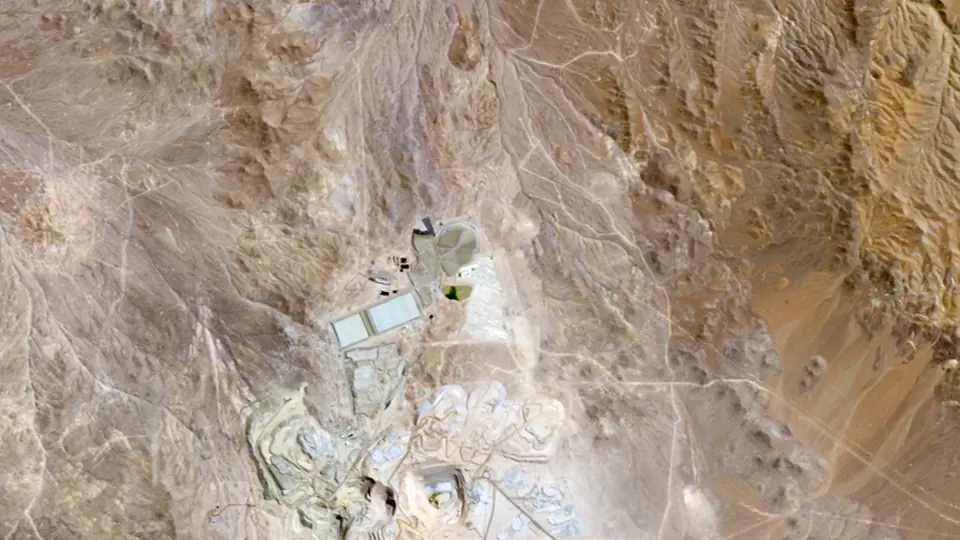 2010 · 22 Mar 2011
Landsat 5
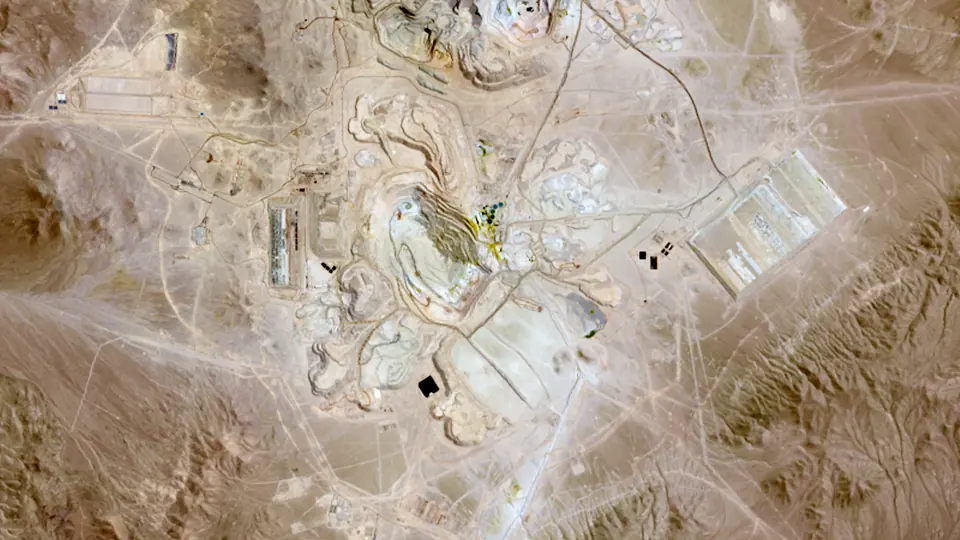 2015 · 14 Mar 2014
Landsat 8
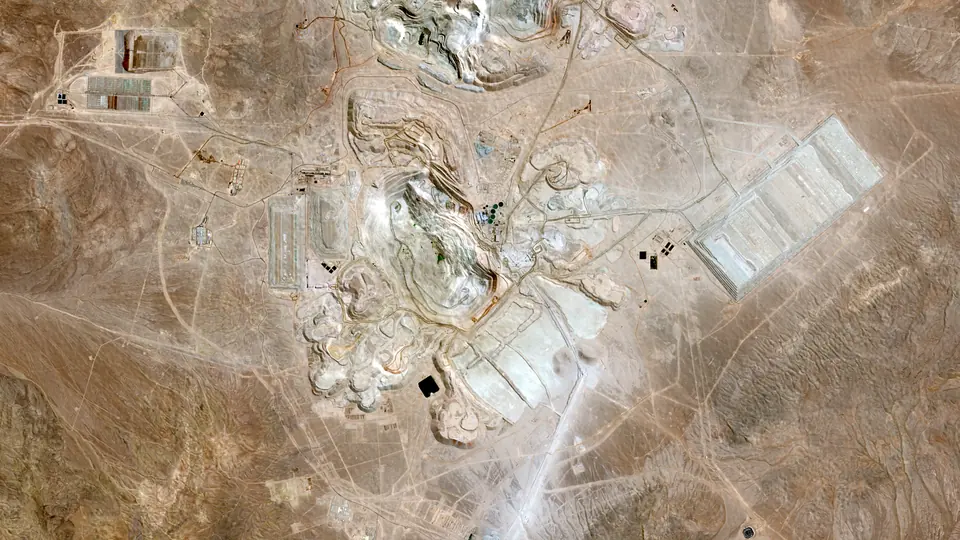 2020 · 24 Mar 2020
Sentinel-2A
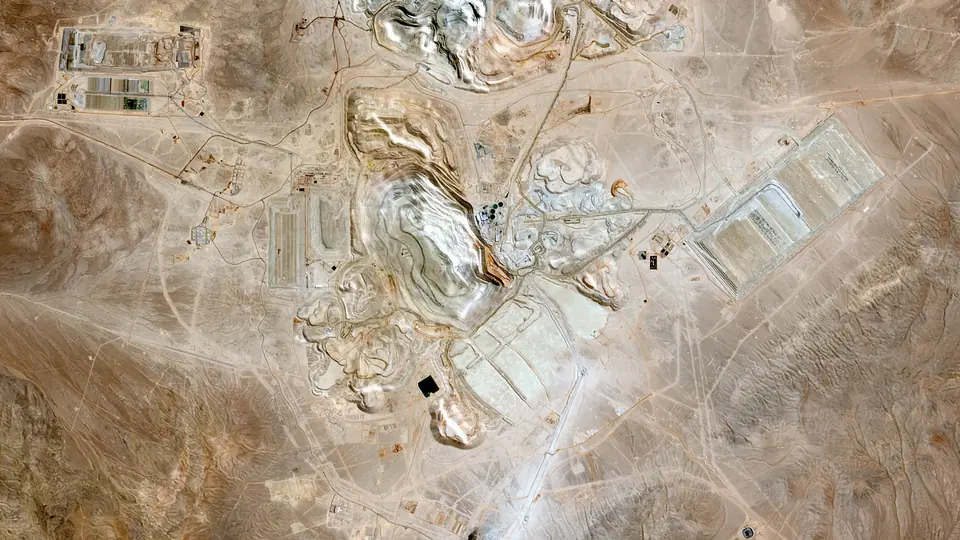 2025 · 28 Mar 2025
Sentinel-2C
What happened here
- 1978 Exploration begins. Geochemical exploration in the area from 1978 led to the discovery. [1]
- 1981 Drill hole 23. Utah International began exploring the Quebrada Escondida in 1981. Drill hole 23 hit rich chalcocite and bornite below 300 m of barren cover. [2]
- 1991 Production begins. Escondida began operating in 1991; BHP marked 35 years of production in its 2026 annual report. [1]
- 2025 1,305 kt of copper. BHP reports 1,305 kt of copper from Escondida in the year to June 2025 and 1,261 kt the year after, on a 100 per cent basis. [1]
More on the mine's history is on Escondida in the history of mining, and on the copper page and mining in Chile.
Copper output by year
Copper output from Escondida in the years with an open, mine-level figure: the Jasansky et al. open database of mine production (CC BY 4.0) and the operators' own filings. Years with no open mine-level figure are left out rather than estimated. The timeline under the pictures shows the same bars.
The figures
| Year | Output | Basis | Source |
|---|---|---|---|
| 2001 | 775 kt | contained copper | [3] |
| 2002 | 754 kt | contained copper | [3] |
| 2003 | 993 kt | contained copper | [3] |
| 2004 | 1,207 kt | contained copper | [3] |
| 2005 | 1,270 kt | contained copper | [3] |
| 2006 | 1,313 kt | contained copper | [3] |
| 2007 | 1,406 kt | contained copper | [3] |
| 2008 | 1,282 kt | contained copper | [3] |
| 2009 | 1,061 kt | contained copper | [3] |
| 2010 | 1,011 kt | contained copper | [3] |
| 2011 | 759 kt | contained copper | [3] |
| 2012 | 1,047 kt | contained copper | [3] |
| 2013 | 1,122 kt | contained copper | [3] |
| 2014 | 1,138 kt | contained copper | [3] |
| 2015 | 1,149 kt | contained copper | [3] |
| 2016 | 1,011 kt | contained copper | [3] |
| 2017 | 903 kt | contained copper | [3] |
| 2018 | 1,168 kt | contained copper | [3] |
| 2026 | 1,261 kt | Cu, 100% basis, year to June 2026 | [1] |
Photos
Pictures from the ground and from orbit, openly licensed. The viewer slips each one in near its year.
How this was made
Pictures. Landsat 4 and 5 (to 2011), Landsat 7 (before its 2003 scan-line fault), Landsat 8 and Sentinel-2 (2017 on), surface reflectance read from Microsoft's Planetary Computer. For each frame we take the clearest picture within a year or so of the target year, in the same season where we can, checked against each scene's own cloud mask, and cut it to one grid. One colour stretch serves every frame, and each older frame is colour-matched to the newest over the whole picture, so a change in colour is mostly a change on the ground. Landsat pixels are 30 m and Sentinel-2 pixels 10 m, so the newest frames are sharper. The date of each picture shows under the year.
The bare desert defeats our automatic mapping of worked ground (grey dumps look like the desert they sit on), so this district has no outline layer; the pictures show the change.
Output and milestones. Each figure and fact is linked to its source below. We report what operators and governments published and do not estimate missing years.
Sources and credits
- BHP Group (SEC): Form 20-F for the year ended 30 June 2026
- Guia Minera de Chile: La genesis de Escondida: el hallazgo que transformo la mineria chilena (opinion column by a participant)
- Jasansky, Brauneis, Maus et al. (Vienna University of Economics and Business): Open database on global coal and metal mine production (Zenodo v1.0.3; paper: Scientific Data 2023)
Satellite pictures: USGS/NASA Landsat (public domain) and contains modified Copernicus Sentinel-2 data 2025, via Microsoft Planetary Computer, processed by Prospector Trails. Photos: Escondida, 2005: Bachelot Pierre J-P, Wikimedia Commons, CC BY-SA 3.0; From the ISS, 2009: NASA, Expedition 22 crew, Wikimedia Commons, Public domain; Escondida, 2010: Municipalidad de Antofagasta, Wikimedia Commons, CC BY 2.0. Not investment advice.


More time machines
 20251986Kalgoorlie Super PitThe Golden Mile's old leases become one open pit, 3.5 km long.1986 to 2025 · Australia
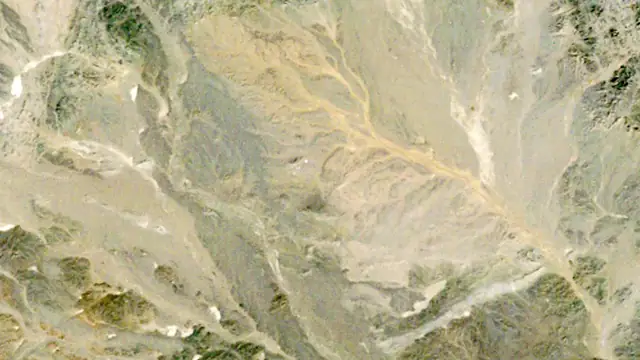 20251986Oyu TolgoiNothing for twenty-five years, then a whole mine in ten.1986 to 2025 · Mongolia
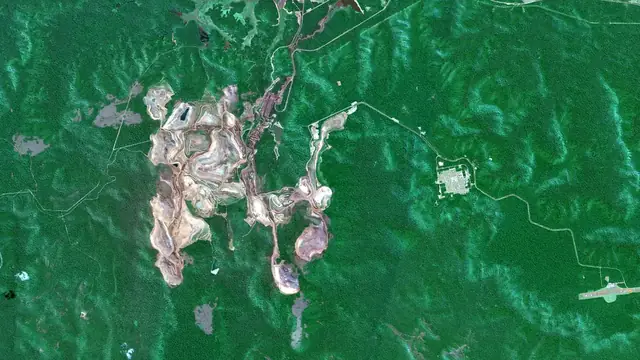
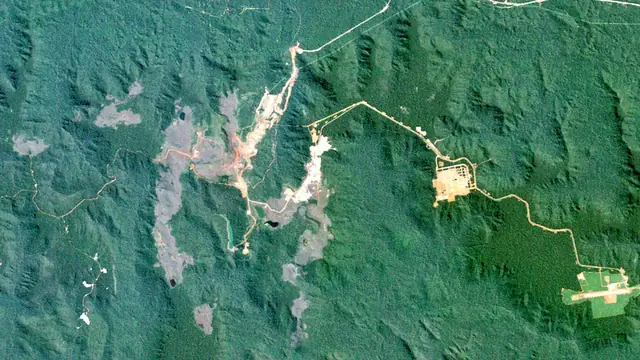 20251984CarajásRed iron pits open into the Amazon forest from 1984.1984 to 2025 · Brazil
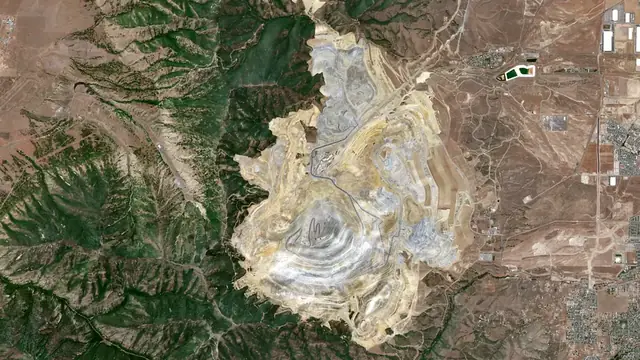
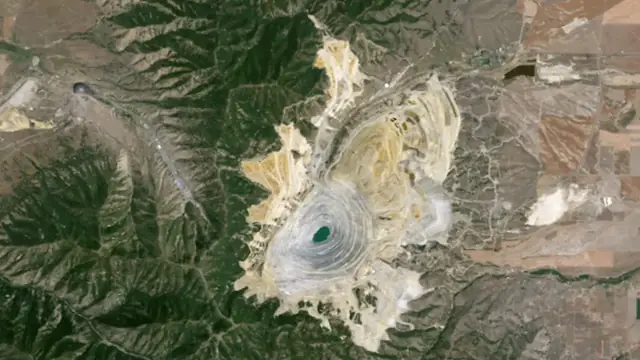 20261986Bingham CanyonMined since 1903 and still widening.1986 to 2026 · United States
Keep exploring
Keep exploring

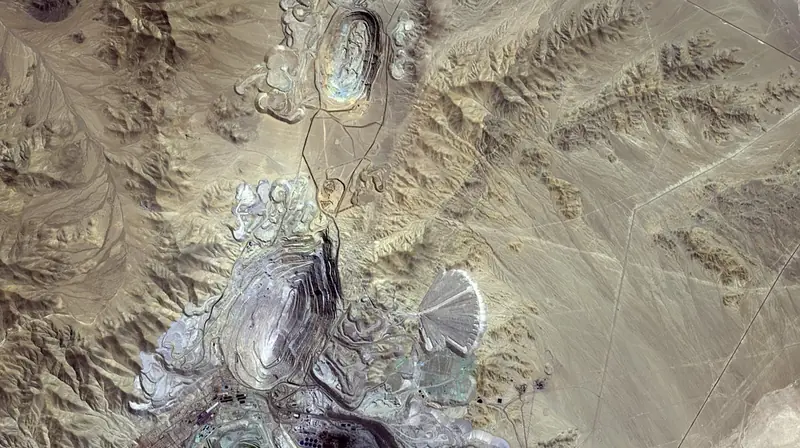 The world runs on rockThe GridCopper, the metal of electricity


All mining storiesThe world runs on rockAll mineralsMining by country
Cover photos from Wikimedia Commons: Chuquicamata from the ISS by Alexander Gerst (ESA), CC BY-SA 2.0; Haul trucks by Lechhabmed, CC BY-SA 4.0; Drilling and blasting by Siim Roov, CC BY-SA 4.0.