
The world runs on rock · The Map
The Map every story on one globe
Fifteen stories, and the same few places keep coming back. Each light is a place the stories stop; each thread is one story's route. Pick a light, pick a story, or travel through them all.
Every stop, story by story
The globe above, as a list. Open a story to read its stops; each links to the full story with its 3D scenes and sources.
 The patternwhere the stories' threads meet
- DR Congo · The mines are spread out
Mining is less concentrated than refining. Chile leads copper with 23%, DR Congo cobalt with 74%, Indonesia nickel with 67% and Australia lithium with 32%.2
- China · The refineries are not
Much of the ore is shipped to be refined, and much of it goes to China: 78% of graphite is mined there, and 91% of rare earths were refined there in 2024.3 Nickel is the exception: Indonesia leads its refining.1
- Beijing · The controls
Since 2023 China has put export licences on one metal after another. Many of the stories in this series start with one of these dates.
- Sep 2010Rare-earth shipments to Japan reported halted.4 The WTO later ruled against China's export quotas.5
- Aug 2023Licences for gallium and germanium.6
- Dec 2023Licences for some graphite.7
- Aug 2024Export restrictions on antimony announced.8
- Dec 2024Gallium, germanium and antimony exports to the US banned.6
- Feb 2025Controls on tungsten items, indium and others.9
- Apr 2025Licences for seven rare earths and their magnets.10
- Nov 2025The US ban and October's wider rare-earth rules suspended until November 2026.11, 15
- Mountain Pass · The response
In July 2025 the US Defense Department agreed to take a stake in MP Materials, which mines rare earths at Mountain Pass, California, and to guarantee a floor price of $110 a kilogram for its neodymium-praseodymium.12 Lynas of Australia separates its rare earths in Kuantan, Malaysia.13
The EU's Critical Raw Materials Act sets 2030 goals: to mine 10% of the strategic raw materials it uses, process 40% and recycle 25%, and to take no more than 65% of any one of them from a single outside country.14
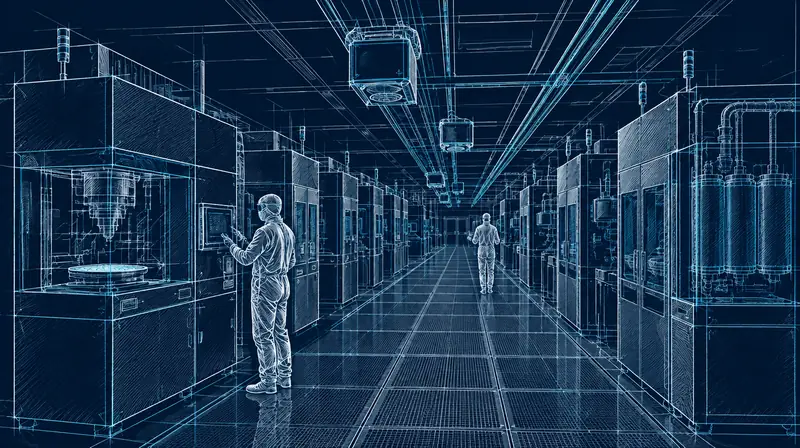 01The Chipthe minerals inside every computer chip
Every phone, car, satellite and AI model runs on chips. Each one is built from more than a dozen minerals, refined in a handful of places and assembled in fewer still. When one link breaks, factories on the other side of the world stop.
- Spruce Pine · Quartz
High-purity quartz from Spruce Pine is refined and shipped to crucible makers, mostly in Asia.
- China · Silicon metal
Smelted mostly in China, which accounted for almost 80% of the world's silicon materials in 2025.
- China · Gallium and germanium
Refined almost entirely in China: 99% of primary gallium.
- DR Congo · Tantalum
Mined mostly in Central Africa: DR Congo 52%, Rwanda 16% and Nigeria 16% of 2025 output.
- China · Tungsten
China mined 79% of the world's tungsten in 2025.
- Odesa · Neon
The lasers that print chips need ultra-pure neon. Before 2022, two Ukrainian firms, Ingas in Mariupol and Cryoin in Odesa, supplied an estimated 45 to 54% of the world's chip-grade neon.
- Japan · Wafers and machines
Wafers are grown and polished by a few specialist makers, several of them in Japan. The lithography machines that print the finest features come from ASML in the Netherlands.
- Taiwan · The fabs
Everything converges on a few fabs. In 2019, about 92% of the world's capacity for the most advanced logic chips, below 10 nanometres, was in Taiwan.
- Shenzhen · Out to everything
Finished chips are tested and packaged, mostly in Asia, then fly out to the factories that make phones, cars, servers and fridges.
 02The Mindthe metal and power behind AI
Every answer an AI model gives is computed on chips, in racks, in buildings that draw as much power as a city. Behind the software are copper, silicon, gallium and steel, a few factories in Taiwan, and a grid that has to grow to feed it.
- Taiwan · Made in Taiwan
Nvidia's Blackwell chips are made by TSMC in Taiwan. Almost every AI lab's computing starts in the same few fabs.
- New Carlisle, Indiana · Project Rainier, Indiana
Amazon's campus at New Carlisle runs nearly 500,000 of its Trainium2 chips for Anthropic's Claude, and is planned to draw up to 2.2 gigawatts when finished.
- Richland Parish, Louisiana · Hyperion, Louisiana
Meta's campus in Richland Parish is planned at 5 gigawatts, with more than $50 billion of investment.
- Abilene, Texas · Stargate, Texas
OpenAI announced Stargate in January 2025 with SoftBank, Oracle and MGX: up to $500 billion of AI infrastructure in the US, with its first site at Abilene, Texas.
- Indiana · Anthropic
In October 2025 Anthropic agreed to use up to one million Google TPUs, well over a gigawatt of capacity in 2026. A month later it announced $50 billion for its own data centres in Texas and New York, built with Fluidstack.
- Hangzhou · Hangzhou
DeepSeek and Alibaba's Qwen team publish open-weight models that anyone can download and run. They are trained on the same kinds of chips, under export rules that limit which ones they can buy.
- China · Gallium
China refined 99% of the world's primary gallium in 2025. Data centres could need more than a tenth of today's supply by 2030.
- Chile · Copper
The wiring, cold plates, busbars, cables and transformers are copper. Chile mined 23% of it in 2025, DR Congo 14%.
- Japan · A Japan of power
The IEA's base case for data centres in 2030, about 945 TWh, is slightly more than all the electricity Japan uses today.
 03The Batteryinside a lithium-ion cell
Your phone, your laptop and more than 17 million new cars a year run on lithium-ion cells. Each one is a tight roll of metal foils and mineral powders, from salt flats in Chile, pits in Australia, mines in Congo and refineries in China.
- Australia · Lithium
Australia 32%, China 21%, Chile 19%, Argentina 7.9% of 2025 mine output.
- DR Congo · Cobalt
DR Congo mined 74% of the world's cobalt, most of it as a by-product of copper around Kolwezi.
- Indonesia · Nickel
Indonesia mined 67% of the world's nickel in 2025, much of it smelted in industrial parks at Morowali and Weda Bay.
- China · Graphite
China mined 78% of the world's natural graphite. Many anodes use synthetic graphite instead, made from petroleum coke.
- South Africa · Manganese
South Africa 38% and Gabon 25% of the world's manganese ore.
- China · Refining
Mining is spread out; refining is not. For copper, lithium, nickel, cobalt, graphite and rare earths, the top three refining countries held 86% of the market on average in 2024, and nearly all recent growth came from China, and Indonesia for nickel.
- China · Out to the roads
More than 17 million electric cars were sold in 2024, over 11 million of them in China.
 04The Magnetrare earths that turn power into motion
Electric cars, wind turbines, phones, drones and hard drives all turn electricity into motion with small, ferociously strong magnets. Nearly all of them are made of neodymium, iron and boron, and nearly all of them are made in China.
- China · Mining
China 69%, the United States 13%, Australia 7.4% and Myanmar 5.6% of 2025 mine output. For the rare earths used in magnets, the IEA puts China's share of mining at 60% in 2024.
- China · Separating
Rare earths come out of the ground mixed together and are among the hardest elements to separate. China did 91% of the world's refining in 2024. Australia's Lynas separates its own ore in Malaysia; most of the rest is separated in China.
- China · Making magnets
In 2005 China made about half the world's sintered permanent magnets. By 2024 its share was 94%. From there they ship to motor and car plants everywhere.
- China · The pinch point
One country mines most of the ore, separates almost all of it and makes almost all the magnets. That is why a licence form in Beijing can stop a car plant in Chicago.
 05The Rocketthe metals that survive launch
A rocket has to be light enough to fly and tough enough to hold a controlled explosion. That takes lithium in its tanks, niobium and hafnium in its engines, chromium and nickel in its steel, and germanium under the solar cells of what it carries.
- Brazil · Niobium
Brazil mined 93% of the world's niobium in 2025, Canada 5.4%. One company, CBMM, at Araxá in Minas Gerais, supplies over 80% of the world's niobium products. Most niobium goes into steel; rocket nozzles are a tiny, demanding corner of the market.
- South Africa · Chromium
South Africa mined 45% of the world's chromium ore, Türkiye 18% and Kazakhstan 14%.
- Indonesia · Nickel
Indonesia mined 67% of the world's nickel in 2025, the same nickel that goes into batteries and stainless steel.
- China · Gallium and germanium
China refined 99% of the world's primary gallium in 2025, and 68% of its germanium in 2021. Both go into the solar cells that power satellites.
- Hawthorne, California · To the pad
The metals meet in the factory at Hawthorne, California, and fly from Florida and California; Starship is built and launched at Starbase in Texas.
 06The Signalthe glass and metal under the sea
Send a message to another continent and it almost certainly travels as flashes of light through glass threads on the sea floor. Those threads are spun from quartz and spiked with germanium, wrapped in steel and copper, and laid by ship across every ocean.
- The cable network · The cables
About 570 systems in service, from short links between islands to cables tens of thousands of kilometres long. A few of the main routes are drawn here.
- China · Germanium
China produced 68% of the world's refined germanium in 2021, the latest year with a country breakdown.
- China · Gallium
And 99% of the world's primary gallium in 2025. In August 2023 China put both metals under export licences; in December 2024 it banned their export to the US, a ban suspended in November 2025 until November 2026.
- Southern Red Sea · An anchor in the Red Sea
The cargo ship Rubymar, hit in a Houthi missile attack, drifted for about two weeks before it sank. US officials said its dragging anchor most likely cut three cables, Seacom, AAE-1 and EIG. Hong Kong's HGC estimated they carried about 25% of the traffic in the region.
- Southern Red Sea · And again
More cuts in the Red Sea slowed internet traffic between Asia, the Middle East and Europe. Microsoft warned Azure customers of higher latency as traffic was rerouted, and said undersea repairs "can take time".
 07The Shieldthe minor metals defence depends on
Radars, jet engines, armour and ammunition depend on metals most people never hear of: gallium, tungsten, antimony, beryllium, the rare earths. For most of them a single country supplies the bulk. This story is about what they are made of and where it comes from, not how any weapon works.
- China · Tungsten
China mined 79% of the world's tungsten in 2025. The United States has not mined it commercially since 2015.
- China · Antimony
Three countries mined more than four-fifths of it: China 36%, Russia 29%, Tajikistan 20%. In the United States, 49% went into flame retardants and 40% into antimonial lead and ammunition.
- China · Gallium
Gallium is a by-product of refining aluminium ore, and nearly all the refineries that recover it are in China: 99% in 2025.
- Utah · The exception
Beryllium is the one on the shelf the United States leads: 53% of world mine output in 2025, from one company mining bertrandite ore in Utah.
 08The Bodythe metals inside medicine
A hospital scanner holds a magnet bathed in liquid helium and wound with niobium and titanium. A pacemaker runs on lithium inside a titanium case. A new hip is titanium and cobalt-chromium. And the most common nuclear scan depends on a handful of ageing reactors.
- United States · Helium
Helium is mostly recovered from natural gas. In 2025 the United States produced 81 million cubic metres, Qatar 63 million, Russia 18 million and Algeria 11 million, out of about 190 million worldwide. MRI took 15% of US helium use. The EU and US bans on Russian helium continued in 2025.
- China · Titanium
Titanium metal starts as "sponge". China made 260,000 of the world's 370,000 tonnes in 2025, Japan 53,000. The United States made none; most of its titanium goes to aircraft, and some to medical implants.
- DR Congo · Cobalt
The ball of many artificial hips is a cobalt-chromium alloy. DR Congo mined 74% of the world's cobalt in 2025.
- Chalk River, Canada · Where Mo-99 came from
In 2009 molybdenum-99 came from a handful of research reactors, the largest of them NRU at Chalk River in Canada, then 50 years old, and the High Flux Reactor at Petten in the Netherlands. NRU made about a third of the world's medical isotopes and about half of the United States' Mo-99.
- Chalk River, Canada · The reactor stops
NRU was shut down after a heavy-water leak was found in its vessel wall. Petten's reactor had already been out from August 2008 to February 2009 and was due to close for repairs in early 2010.
- Chalk River, Canada · Hospitals ration scans
By August a nuclear medicine department in London, Ontario, was receiving only 40% of its usual Mo-99. Like many clinics in Canada and the US it delayed non-urgent scans and switched patients to other tests. NRU's repairs ran into 2010.
 09The Enginethe jet engine's hottest metals
A jet engine's turbine blades work at metal temperatures above 1,000°C. They manage it with nickel, cobalt, chromium and a pinch of rhenium, one of the rarest metals mined. The fan in front is titanium.
- Chile · Rhenium
Rhenium is a by-product of the molybdenum in copper ores. About 81,000 kg was mined in 2025, Chile 30,000 kg of it. Superalloys take about 80% of US use, and the price of rhenium metal rose from $1,360 to $2,600 a kilogram between 2024 and 2025.
- Indonesia · Nickel
Indonesia mined 67% of the world's nickel in 2025.
- DR Congo · Cobalt
DR Congo mined 74% of the world's cobalt in 2025.
- China · Titanium sponge
Titanium metal starts as porous "sponge". China made 260,000 of the world's 370,000 tonnes in 2025, Japan 53,000, Russia 25,000 and Kazakhstan 16,000. The last US sponge plant closed in 2024; US imports came mostly from Japan.
- VSMPO-Avisma · Boeing stops buying Russian titanium
After Russia invaded Ukraine, Boeing suspended purchases from Russia, home of VSMPO-Avisma, the world's largest titanium supplier, saying its stocks and other sources were enough. Russia had supplied about a third of Boeing's titanium. Airbus kept buying, within sanctions rules.
 10The Gridcopper, the metal of electricity
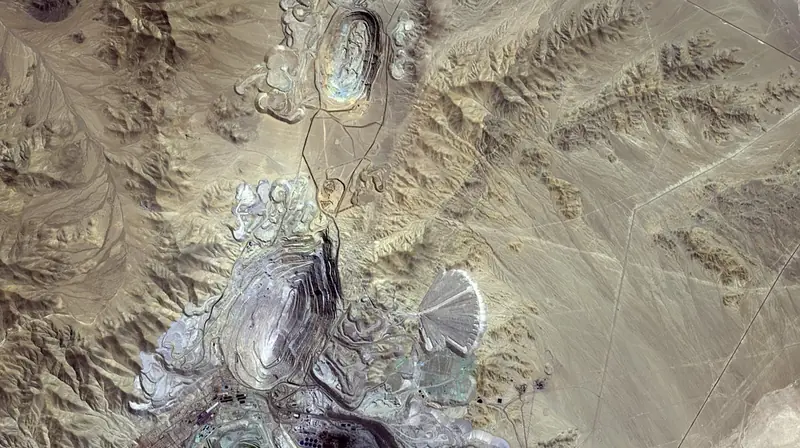
Every power line, transformer, motor and phone charger carries its current through copper. It is so ordinary that the United States only added it to its list of critical minerals in November 2025, along with silver.
- Chile · Mining
Chile 23%, DR Congo 14% and Peru 12% of world mine output in 2025.
- China · Refining
Most of that ore is shipped as concentrate. China refined about 14 million of the world's 29 million tonnes of copper in 2025, 48%, while mining under 8%.
- Mexico · Silver
The best conductor of all is too dear for wires, but every solar cell carries a fine silver paste. Photovoltaics took 15% of US silver use in 2025. Silver averaged $38 an ounce that year and hit $53.60 on 13 November. Mexico mined 24% of the world's silver.
 11The Screenthe rare elements in a phone
A phone is a sandwich of glass, metal and silicon a few millimetres thick. When scientists at the University of Plymouth ground one up, they found at least 39 elements inside.
- China · Indium
Indium is mostly recovered from the zinc ore sphalerite, at up to 100 parts per million. China produced 69% of refined indium in 2025 and South Korea 16%. In February 2025 China put indium under export restrictions, and exports of unwrought indium fell 72% between September 2024 and September 2025, as reported by Asian Metal.
- China · Tin
China mined 24% of the world's tin in 2025 and Indonesia 21%. Two halts show how thin the rest can be:
- Aug 2023The Wa State authorities in Myanmar suspended all mining in their area. Wa had supplied over 70% of Myanmar's tin. Myanmar's output fell from about 20,000 tonnes in 2024 to 12,000 in 2025.
- 13 Mar 2025Alphamin halted Bisie in eastern DR Congo, reported as the world's third-largest tin mine, as M23 rebels advanced.
- 9 Apr 2025Bisie began restarting in phases, and the tin price fell back.
- DR Congo · Tantalum
DR Congo mined 52% of the world's tantalum in 2025 and Rwanda 16%. In June 2025 the two governments signed a US-mediated peace agreement that the USGS said, if sustained, could steady the region's mineral trade.
- DR Congo · The 3TG rules
Tin, tantalum, tungsten and gold are known together as 3TG. Since 2012 a US rule under the Dodd-Frank Act has made companies that file with the SEC report whether their products contain 3TG from DR Congo and its neighbours. Since 1 January 2021 an EU regulation has required importers of these metals to check their supply chains.
 13The Drone Warminerals behind the drones
The war in Ukraine is the first fought with drones by the million. Each one is a small bundle of rare-earth magnets, copper, lithium cells and silicon chips. Around them sit satellites, kilometres of glass fibre, and a fight over the minerals in Ukraine's own ground.
- Shenzhen, China · Parts
Motors, magnets, cells and chips flow out of southern China to drone workshops in Ukraine and to Alabuga in Russia. China's share of Ukraine's drone-part imports was 28% in early 2026; most of the magnets are still Chinese.
- Odesa · Noble gases
Before 2022, Ingas in Mariupol and Cryoin in Odesa supplied an estimated 45 to 54% of the world's chip-grade neon. Both stopped when Russia invaded. Ukraine was also a big source of krypton and xenon, gases that space thrusters use. The Chip tells the neon story.
- Russia · Russia's metals
Russia mined 44% of the world's palladium in 2025, mostly at Norilsk, and is a big producer of nickel, aluminium and titanium.
- Shevchenko lithium · Ukraine's ground
Ukraine has lithium, titanium, graphite and rare earths, much of it unmined. On 30 April 2025 it signed a minerals deal with the United States that set up a joint investment fund. Two of its best-known lithium deposits are in the war zone: Russia claimed in June 2025 to have taken the village over the Shevchenko deposit, and had earlier captured Kruta Balka in Zaporizhzhia.
 14SpaceXthe metals behind Starship and Starlink
The biggest rocket ever flown is made of steel. Its engines run on copper and nickel superalloys. Its satellites are pushed around by argon, because krypton ran short. Here are the metals in SpaceX's machines, and the times shortages have already hit it.
- South Africa · Chromium
Every stainless-steel ring needs chromium. South Africa mined 45% of the world's chromium ore in 2025, Türkiye 18% and Kazakhstan 14%.
- Indonesia · Nickel
Nickel goes into the steel and the superalloys. Indonesia mined 67% of the world's nickel in 2025.
- Chile · Copper
Copper lines the engines and wires everything else. Chile mined 23% of the world's copper, DR Congo 14%.
- Starbase, Texas · To Texas
Starship is built and launched at Starbase in south Texas; Falcon rockets are built in Hawthorne, California, and fly from Florida and California.
- Odesa · Odesa and Mariupol
Cryoin in Odesa and Ingas in Mariupol purified noble gases for the world's chip and space industries. Both stopped in 2022.
- China · Gallium and germanium
Satellite solar cells and many fast radio chips start with gallium or germanium. China refined 99% of the world's gallium and 68% of its germanium. It required export licences from August 2023, banned exports to the US in December 2024, and suspended that ban in November 2025 until November 2026.
- 2021Chip shortage slows Starlink dishes.
- 2022War stops Ukraine's krypton, neon and xenon plants.
- 2023Starlink switches its thrusters from krypton to argon.
- 2024China bans gallium and germanium exports to the US.
 15The Deepthe race for metal on the seabed
Four kilometres down in the Pacific, billions of tonnes of black lumps lie on the mud, each holding manganese, nickel, copper and cobalt, the metals of batteries and steel. They took millions of years to grow. In 2025 the United States moved to start mining them.
- Clarion-Clipperton Zone · The zone
The Clarion-Clipperton Zone lies in international waters. Under the UN Law of the Sea, the International Seabed Authority in Jamaica regulates mining there, and has so far issued exploration contracts only.
- DR Congo · Against the land
On land, DR Congo mined 74% of the world's cobalt in 2025, Indonesia 67% of its nickel, and South Africa 38% of its manganese. Supporters of seabed mining argue the nodules would add a new source outside those countries; opponents argue the price would be paid in an ecosystem barely studied.
- Kingston, Jamaica · The rules stall
- Jun 2021Nauru, sponsoring a subsidiary of The Metals Company, starts a two-year clock for the ISA to finish its mining rules.
- 2023The deadline passes without a mining code.
- Dec 2024Norway pauses plans to license seabed mining in its Arctic waters.
- Feb 2025The Cook Islands sign a seabed minerals deal with China.
- TMC USA application · The US goes its own way
On 24 April 2025 an executive order told NOAA to speed up seabed mining licences under the Deep Seabed Hard Mineral Resources Act, a US law of 1980 that predates the ISA. TMC USA filed a combined exploration and commercial recovery application on 6 February 2026 for about 65,000 km² of the zone, with an estimated 619 million tonnes of wet nodules. NOAA found it complete; public comment closed on 19 October 2026. Next come certification and an environmental impact statement before any permit.
 16The IceGreenland's rare earths
At the southern tip of Greenland, between two fjords, lies a body of rock layered like a cake: black, red, white, again and again. The red layers hold rare earths, the metals of magnets. Washington, Beijing and Brussels all want a say in what happens to them.
- Greenland · On the map
Greenland has the world's eighth-largest rare-earth reserves, about 1.5 million tonnes. Both big deposits lie in the same body of rock near Narsaq.
- China · Who refines
China mines 69% of the world's rare earths and did 91% of the refining in 2024. That is why a deposit outside China matters, and why who owns it matters too: China's Shenghe Resources holds a 6.5% stake in Energy Transition Minerals, the company behind Kvanefjeld.
- Pituffik · Two projects, two paths
- Dec 2021Greenland bans mining of ore with more than 100 ppm uranium, which in effect stops Kvanefjeld. Its owner went to arbitration in 2022; it is still unresolved.
- Jun 2025The US Export-Import Bank sends Critical Metals a letter of interest for a US$120 million loan for Tanbreez.
- May 2026Critical Metals gets approval to buy 70% of 60° North Greenland ApS, and plans a Saudi joint venture to refine part of its output.
- Sep 2026A US–Denmark–Greenland agreement widens US military access, at Pituffik, Narsarsuaq and Mestersvig, and limits investment from outside NATO and the EU in resource extraction.
- 29 Sep 2026Greenland approves Tanbreez's mining and closure plans, valid to 2050. Operating permits and financing are still needed.
- 2028–29The company's target for first ore. A target, not a promise.
 17The TownKiruna, moved for the iron underneath
In the far north of Sweden, a town of red wooden houses sits next to the world's largest underground iron ore mine. The ore runs under the town, so the town is moving: house by house, street by street, three kilometres east. In August 2025 it moved its church, whole, on wheels.
- Sweden · Europe's iron
Sweden is a small iron ore producer by world standards, about 1.1% of mined iron ore, next to Australia's 38%. But in Europe it is almost everything: LKAB says it produced 86% of all the iron ore mined in the EU in 2025, and that Kiruna and Gällivare are the world's largest underground iron ore mines.
- Kiruna · Out by rail
The ore is crushed, concentrated and made into pellets and fines, then carried on the Iron Ore Line to the ports of Luleå on the Baltic and Narvik in Norway, whose ice-free harbour ships all year. LKAB delivered about 26 million tonnes of iron ore products in 2025.
- Per Geijer · Rare earths next door
In January 2023 LKAB said the Per Geijer deposit, next to the Kiruna mine, held more than a million tonnes of rare-earth oxides, the largest known in Europe; by June it raised the figure to over 1.3 million. Its 2025 report puts its rare earths across Kiruna, Gällivare and Per Geijer at about 3.1 million tonnes in situ. China mines 69% of the world's rare earths.
The EU named Per Geijer a Strategic Project in 2025. Mining it, and going below 1,365 m, still needs permits.
- Talga: Vittangi · The neighbours
Listed explorers are drilling across the same orefield and further south: Talga's Vittangi graphite about 50 km east of Kiruna, Basin Energy's uranium projects, Kendrick, Beowulf and others. Their published drill results are on our globe.
Sources
Shares of world output are from USGS Mineral Commodity Summaries 2026 via our minerals data. Each stop on the globe is taken from its story, where every figure is sourced; the pattern stops are sourced below. Cover photos: NASA, NOAA and USGS, public domain.
- IEA: Global Critical Minerals Outlook 2025, press release (May 2025)
- USGS Mineral Commodity Summaries 2026
- IEA: Rare earth elements, executive summary (refining 91% in 2024)
- New York Times via CNBC: China is blocking minerals, executives say (September 2010)
- WTO: China, measures related to the exportation of rare earths, tungsten and molybdenum (DS431)
- Mining.com: China bans export of gallium, germanium and antimony to the US (December 2024)
- IEA policy database: China's export control measures for graphite items (from 1 December 2023)
- USGS Mineral Commodity Summaries 2026: antimony (export restrictions)
- USGS Mineral Commodity Summaries 2026: tungsten and indium (February 2025 export controls)
- China Briefing: China's rare earth export controls and their impact
- Pillsbury: China suspends export controls on certain critical minerals items (November 2025)
- MP Materials: partnership with the Department of Defense (July 2025)
- Lynas Rare Earths (Wikipedia): Mount Weld mine and the Kuantan plant
- IEA policy database: European Critical Raw Materials Act (2030 benchmarks)
- Fastmarkets: China suspends export prohibition to the US (November 2025)
Keep exploring
Read next
 The world runs on rockThe BatteryInside a lithium-ion cellCurrent eventsThe Drone WarMinerals behind the drones

All mining storiesThe world runs on rockAll mineralsMining by country
Pictures: Salar de Atacama, Chile, NASA/METI/AIST/Japan Space Systems, and U.S./Japan ASTER Science Team (Public domain (NASA media, no copyright)); Pangkalpinang. Mijn 3b. Een reeks koelies bezig met het transporteeren van grond, Europeana (Public Domain Mark 1.0).